Yarmouth Real Estate 2025: Which Villages Appreciated Most—And Where to Buy and Sell in 2026
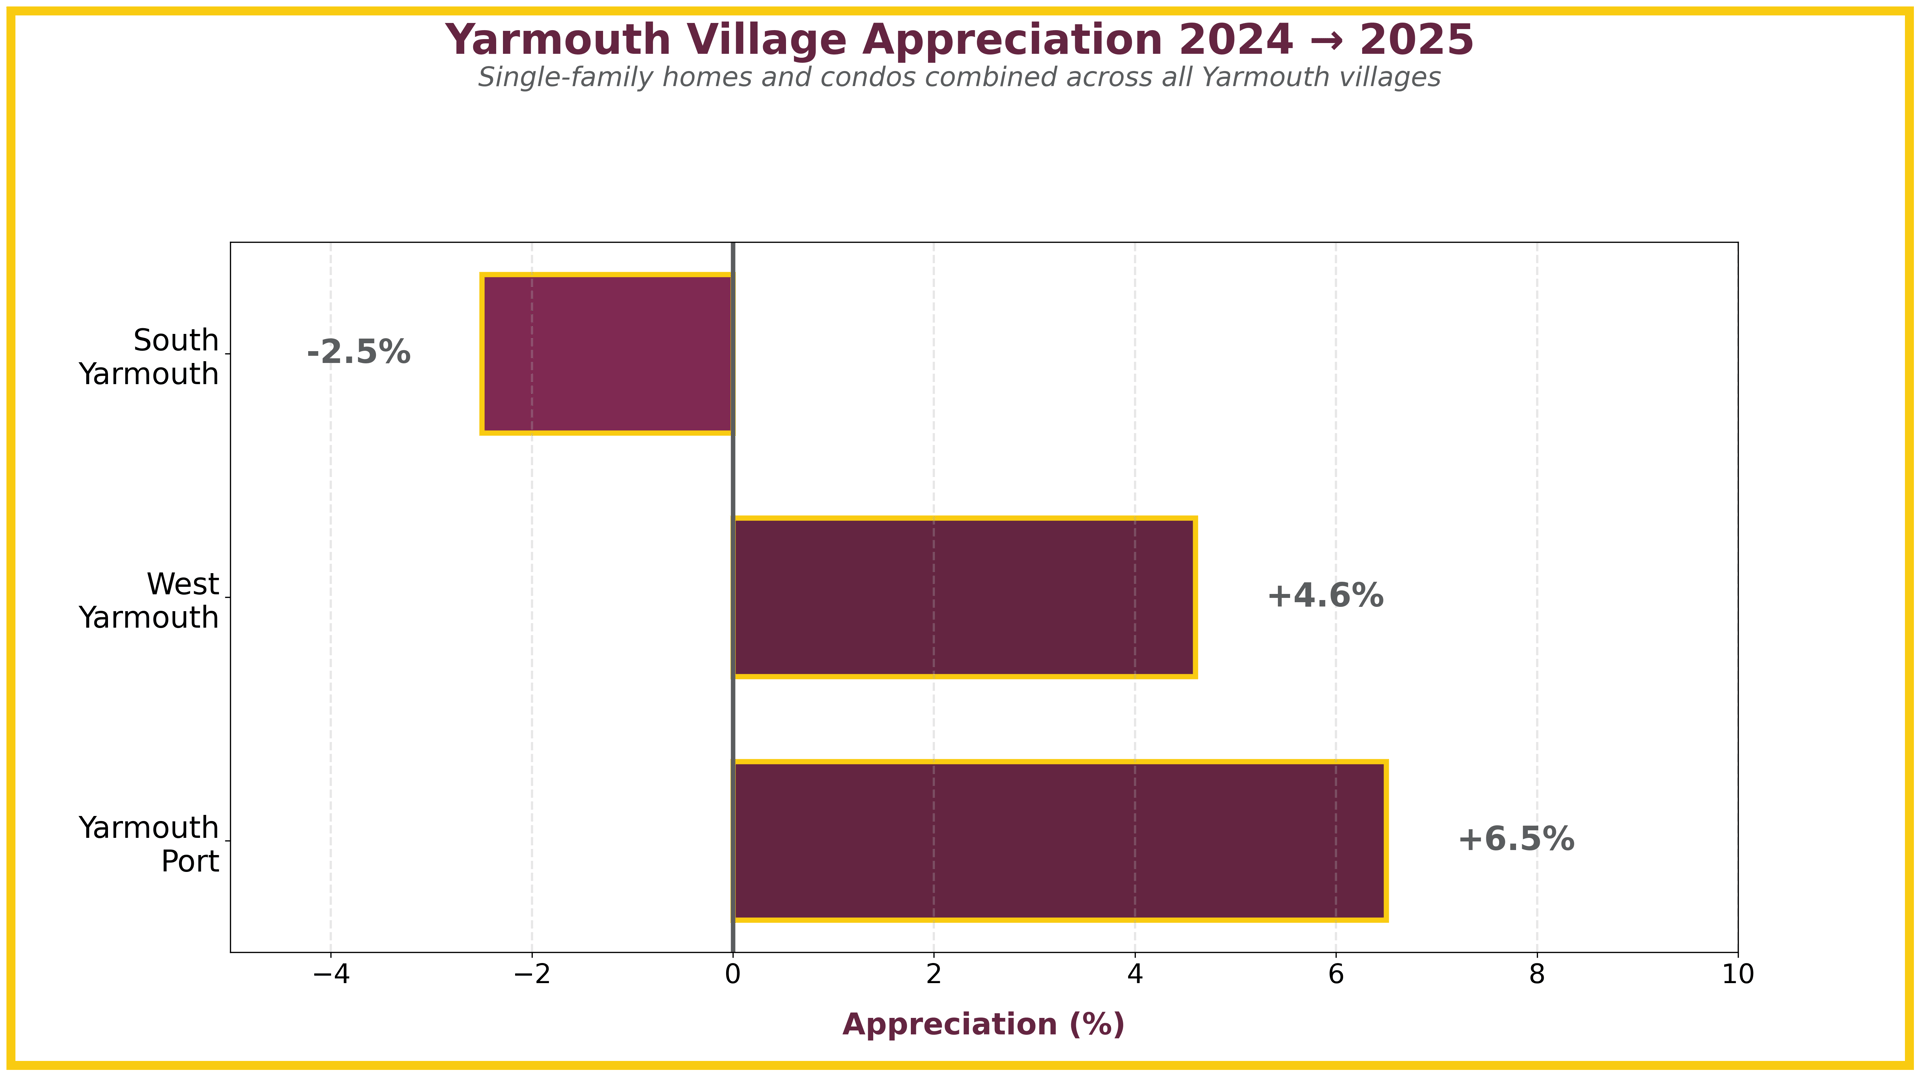
Analyzing single-family homes and condos combined, Yarmouth Port led Yarmouth's 2025 market with +6.5% appreciation, West Yarmouth gained +4.6%, while South Yarmouth saw a -2.5% decline—revealing sharp value differences across villages separated by just a few miles.
QUICK DATA: Yarmouth Real Estate 2025
Market Overview:
Village Performance:
|
Village |
Appreciation |
2024 Median |
2025 Median |
Sales Volume |
|
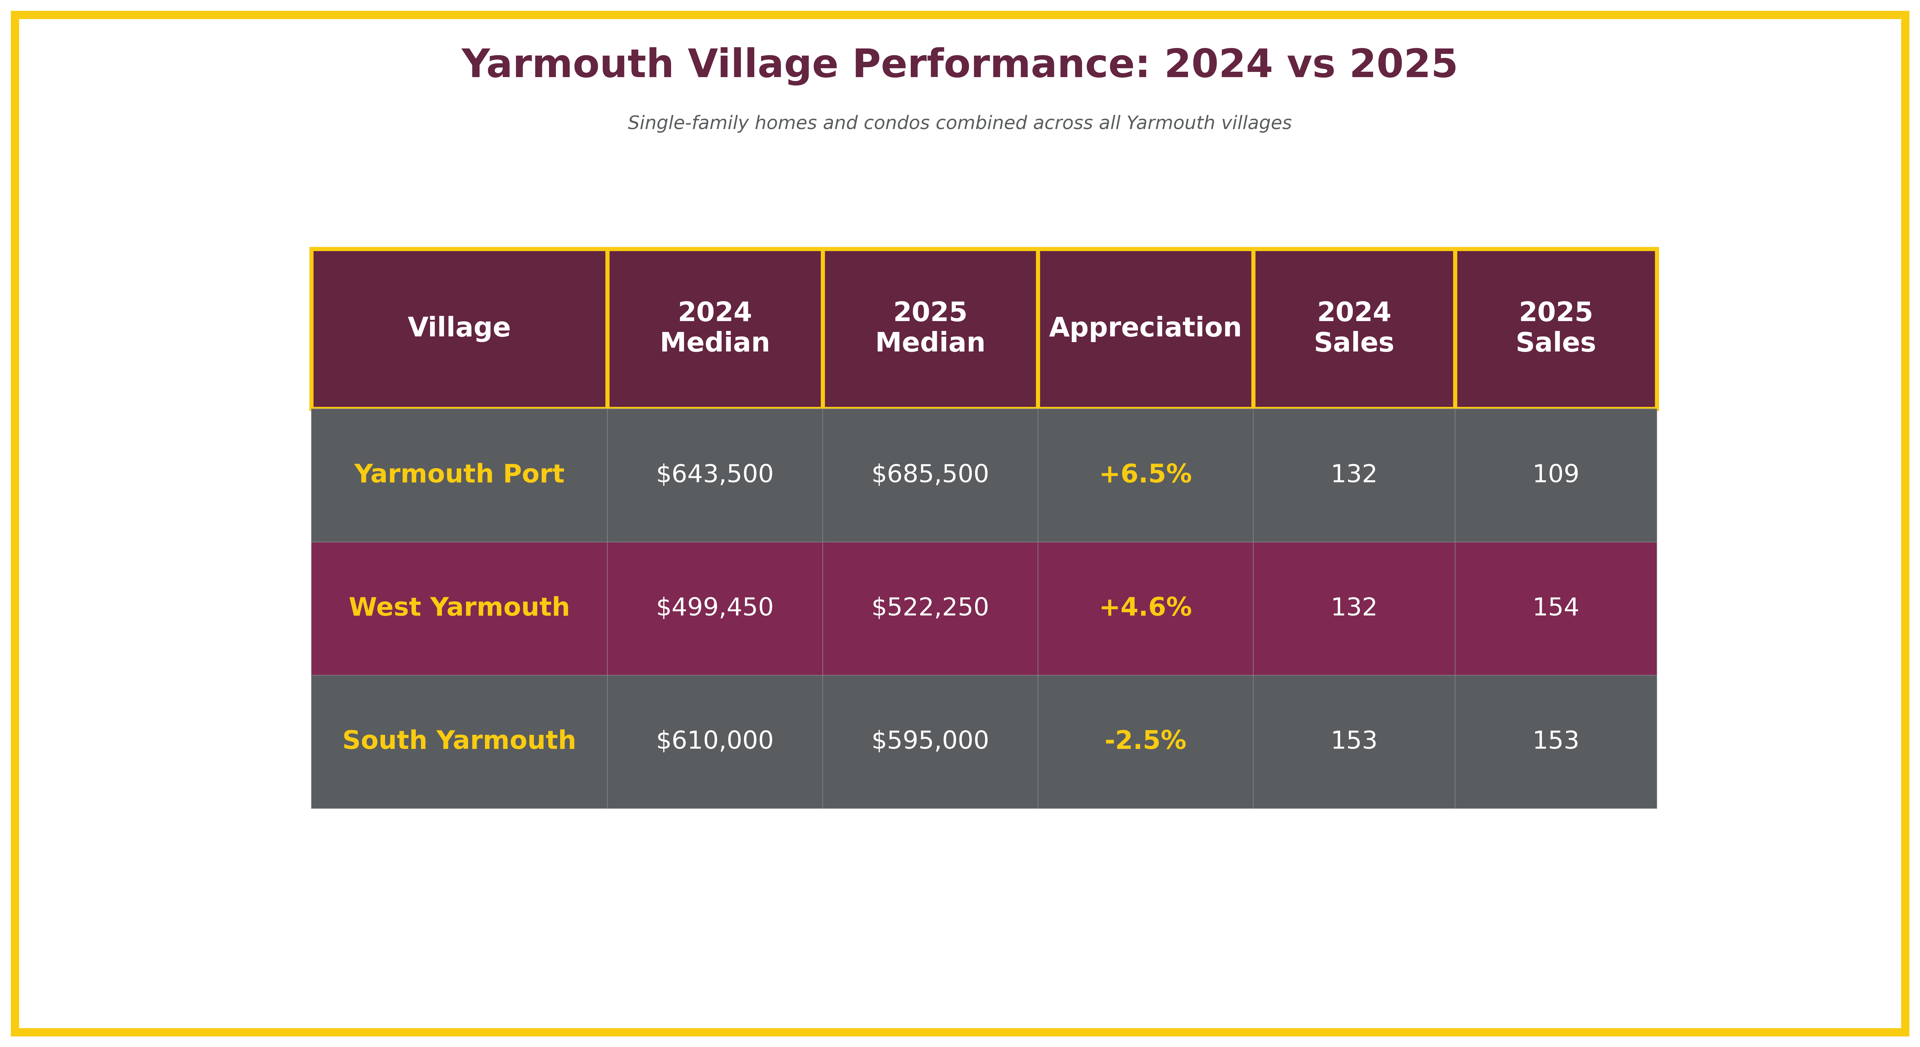
Yarmouth Port |
6.5% |
$643,500 |
$685,500 |
132 → 109 |
|
West Yarmouth |
4.6% |
$499,450 |
$522,250 |
132 → 154 |
|
South Yarmouth |
-2.5% |
$610,000 |
$595,000 |
153 → 153 |
Key Insight: Village-level analysis reveals 9-point appreciation spread masked by town-wide average of +2.3%
Source: MLS analysis by Deborah Camuso, January 2026
If you bought in Yarmouth Port in 2024, by the end of 2025 your property appreciated $42,000. If you bought in West Yarmouth, you gained $22,800. But if you bought in South Yarmouth, you lost $15,000. Same town, same year, three completely different outcomes based solely on which village you chose.
Deborah Camuso analyzed every closed sale in Yarmouth—combining single-family homes and condos—from January through December in both 2024 and 2025 to figure out where homeowners made money, where values declined, and what current market conditions tell us about where to buy and sell in 2026.
Overall, Yarmouth saw 416 sales in 2025 (combining single-family homes and condos), essentially flat from 417 in 2024. Single-family homes specifically showed 317 sales in 2025, down from 328 in 2024—a 3.4% decline that signals buyers becoming more selective. Interestingly, single-family homes outperformed the combined market in some villages, with Yarmouth Port single-family homes appreciating +12.9% versus +6.5% for all properties combined. But analyzing the full market—both homes and condos—reveals the complete story of where Yarmouth buyers are actually putting their money and where appreciation happened across all property types. Where you bought within Yarmouth made all the difference—and where you buy or sell in 2026 matters even more.
Yarmouth Village Appreciation Bar Chart
1. Yarmouth Port: The Clear Winner (+6.5%)
Here's what happened in Yarmouth Port when combining single-family homes and condos: properties that sold for $643,500 in 2024 were selling for $685,500 in 2025. That's a $42,000 gain in one year—the highest appreciation rate in Yarmouth.
This happened even as sales volume dropped significantly—109 sales in 2025 versus 132 in 2024. Fewer properties came on the market across both homes and condos, and the ones that did commanded premiums.
What's particularly interesting: single-family homes in Yarmouth Port outperformed the combined market dramatically, appreciating +12.9% compared to the +6.5% when condos are included. This tells you that buyers competing for single-family homes on historic properties paid substantial premiums, while condo buyers remained more price-conscious.
Why the overall strength? Yarmouth Port offers something unique among Yarmouth's three villages: historic Route 6A character, Cape Cod Bay access, walkability to the village center, and homes with architectural distinction. Buyers shopping above $650,000 want authenticity and charm, and Yarmouth Port delivered both in 2025 across all property types.
Looking ahead to 2026: current market conditions show 18 active listings and 13 pending—strong absolute demand but a more balanced market than the supply-constrained 2025. As prices crossed $685,000, some buyers became more selective. Yarmouth Port's strength remains intact, but the appreciation pace may moderate.
2. West Yarmouth: The Steady Performer (+4.6%)
West Yarmouth's combined median (single-family homes and condos) rose from $499,450 to $522,250—a $22,800 gain that represents strong, consistent performance. Sales actually increased from 132 in 2024 to 154 in 2025, showing sustained buyer interest across all property types.
West Yarmouth attracts buyers looking for Nantucket Sound proximity at an accessible price point. You're getting beach access, summer rental income potential, and a family-friendly community at prices well below Yarmouth Port's premium tier. The condo market here is particularly active, offering buyers entry points under $400K while single-family homes trade in the $550K-$650K range.
The 4.6% appreciation reflects a market where supply and demand stayed balanced. Buyers had choices across both condos and homes, sellers priced competitively, and transactions kept flowing without dramatic swings. This is the definition of a stable, predictable market that delivers steady returns.
And here's the 2026 opportunity: 10 active listings with 7 pending contracts signals strong continued demand. West Yarmouth's steady appreciation combined with active transaction volume suggests buyers who act early in 2026 could see reliable returns in this village's balanced market.
South Yarmouth: The Modest Decline (-2.5%)
South Yarmouth's combined median (single-family homes and condos) dropped from $610,000 to $595,000—a $15,000 decline that made it the only Yarmouth village to see negative appreciation in 2025. Sales volume stayed exactly flat at 153 transactions in both years, so this wasn't a lack-of-activity problem.
Here's what happened: in 2024, South Yarmouth saw a mix of higher-end single-family homes near Bass River that pushed the combined median above $610,000. In 2025, more condo inventory and affordable single-family homes came on the market, pulling the median down. This isn't a market collapse—it's a shift in the mix of what sold.
Buyers still love South Yarmouth for its central location, beach access at Sea View Avenue and Parkers River Beach, and the Bass River corridor. The village offers both affordable condo entry points and single-family homes with rental potential. They're just buying across a wider price spectrum than they did in 2024.
But here's the critical 2026 rebound signal: current market conditions show 8 active listings with 11 pending contracts—the strongest demand ratio of any Yarmouth village. That pending activity suggests buyers see value after the decline. South Yarmouth could rebound strongly in 2026 if sellers price appropriately for current market conditions rather than 2024 peak prices.
Complete Yarmouth Village Performance Table 2024 vs 2025
Looking at all three villages across both single-family homes and condos, three clear patterns emerge:
Premium villages outperformed across all property types. Yarmouth Port's +6.5% combined appreciation (and +12.9% for single-family specifically) versus South Yarmouth's -2.5% decline shows that buyers with $650K+ budgets competed for limited inventory in desirable locations. West Yarmouth's solid +4.6% shows that mid-market villages with good beach access held value well.
Property type mix matters. Yarmouth Port's single-family homes appreciated +12.9% while the combined number (with condos) was +6.5%, showing that premium single-family properties commanded the highest premiums. In West Yarmouth, the reverse happened—strong condo sales helped lift the combined median +4.6% even though single-family appreciation was modest at +1.2%.
Route 6A commanded premiums. Yarmouth Port's historic character and Cape Cod Bay proximity attracted buyers willing to pay for authenticity across both homes and condos. Beach-oriented villages (West and South Yarmouth) competed more on value and access than prestige, with buyers spreading across price points from affordable condos to rental-income properties.
Using the Camuso Village-Level Analysis methodology—which examines sales within village boundaries rather than town-wide averages—here's how Yarmouth's 2025 performance compares to neighboring Mid-Cape communities:
|
Town |
2025 Performance |
Median Price |
Market Trend |
Villages Analyzed |
|
Yarmouth |
+2.3% combined |
$701,000 |
Moderate |
3 villages (spread +6.5% to -2.5%) |
|
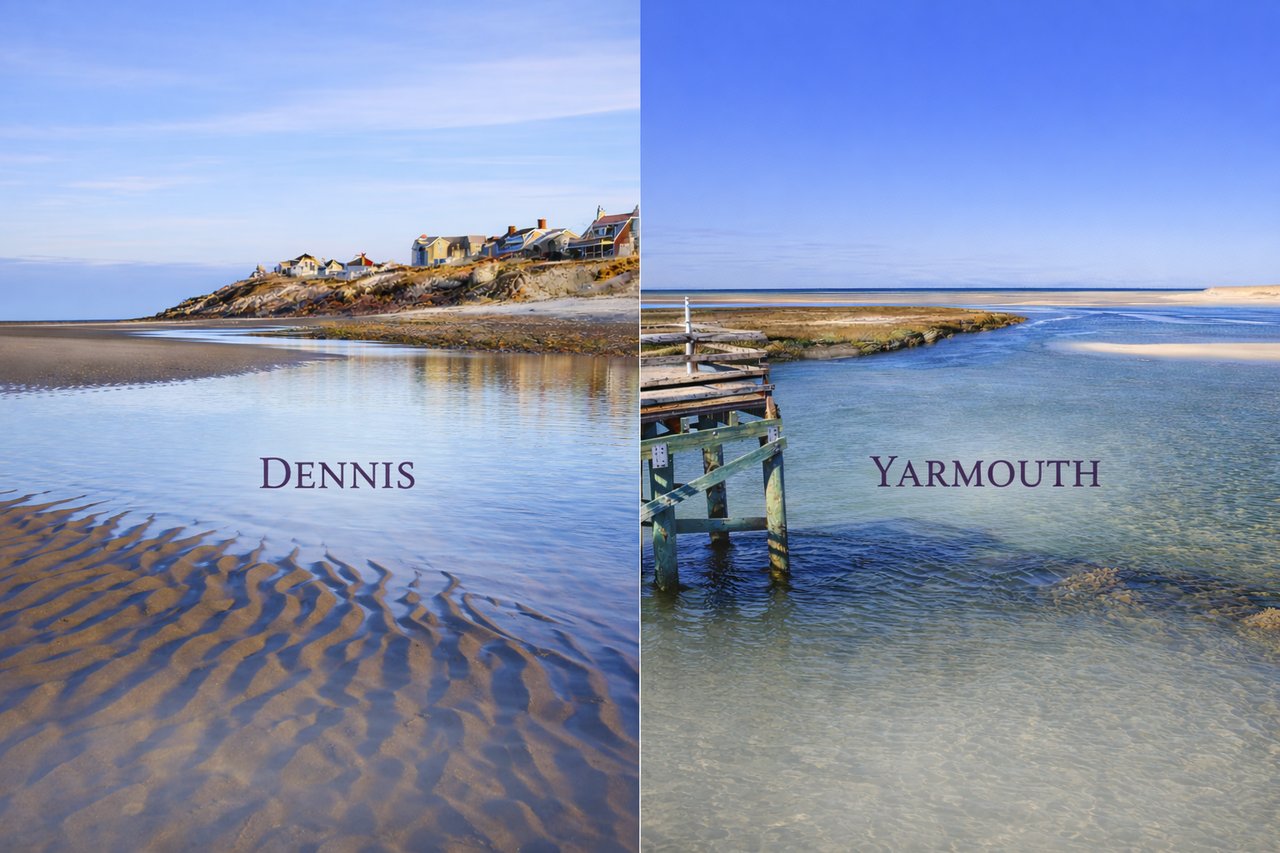
Dennis |
+3.2% combined |
$625,000 |
Moderate |
5 villages analyzed separately |
|
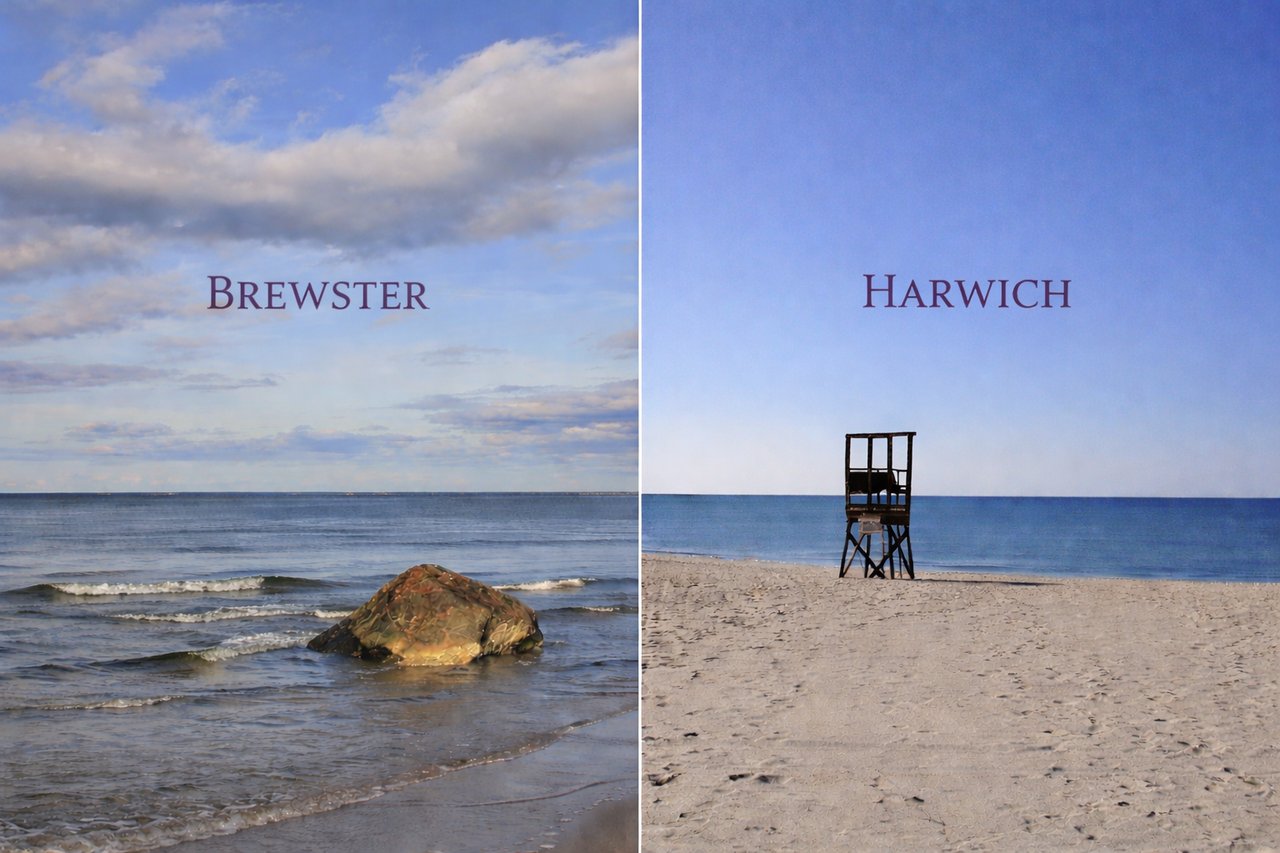
Harwich |
-4.0% combined |
$750,000 |
Cooling |
4 villages (spread +28.1% to -18.1%) |
|
Brewster |
-3.1% SF only |
$850,000 |
Stable |
No village breakdown available |
Source: Deborah Camuso market analysis, January 2026
What this shows: Yarmouth's combined +2.3% performance positioned it as the most stable Mid-Cape market in 2025. While Dennis showed slightly stronger appreciation, Harwich experienced significant corrections in premium villages. Yarmouth's village spread (9 points) was far more moderate than Harwich's dramatic 46-point spread, suggesting more balanced market conditions across all three Yarmouth villages.
For buyers, this means Yarmouth offers Mid-Cape access without the volatility seen in neighboring towns. For sellers, your pricing strategy should focus heavily on which specific village you're in—Yarmouth Port's +6.5% commands different positioning than South Yarmouth's -2.5%.
Planning to buy in Yarmouth this year? Here's what these trends mean for where you should focus:
If you're buying in Yarmouth Port: That +6.5% combined appreciation is real (+12.9% for single-family specifically), but 18 active listings with 13 pending means you'll have more choices than buyers had in 2024. Don't overpay for potential—expect quality for $650K+. Single-family homes will likely continue commanding premiums, while condos offer more negotiating room. Look for properties that need light cosmetic updates where you can add value rather than paying top dollar for fully renovated homes.
If you're buying in South Yarmouth: This is your value opportunity. That -2.5% decline combined with 11 pending contracts on just 8 active listings signals a market ready to rebound. Buyers who recognize the value here—beach access, central location, Bass River proximity—could see strong appreciation return in 2026 as the market corrects. Condos under $400K offer rental income potential, while single-family homes in the $550K-$650K range provide beach lifestyle at accessible prices.
If you're buying in West Yarmouth: Solid +4.6% appreciation plus strong demand (7 pending on 10 active) means you're buying into a proven market with momentum. This is the "Goldilocks" village—not too hot, not too cold. You'll compete with 2-3 other buyers for well-priced properties, but you won't get rushed into bad decisions. Condos start around $350K for beach access, while single-family homes with rental potential run $500K-$600K.
Budget-specific guidance:
Thinking about selling? Here's how to position yourself based on what happened in 2025 and what's happening now:
If you're selling in Yarmouth Port: You've got +6.5% combined appreciation (+12.9% for single-family) in your favor, and current demand is strong (13 pending on 18 active). Price at recent comparable sales—not 10-15% above them. At $650K+, buyers expect quality. For single-family homes especially, invest in professional staging, photography, and pre-listing inspections. Condos need competitive pricing as inventory builds. List in March-April before more spring inventory comes on the market.
If you're selling in South Yarmouth: Don't panic about the -2.5% decline. That 11 pending contracts on 8 active listings shows demand is back strongly. But here's the critical move: price based on recent 2025 sales, not 2024 peak prices. Sellers who try to "test the market" at 2024 prices will sit while competitors price realistically and get multiple offers. Whether you're selling a condo or single-family home, highlight beach access, rental income history, and proximity to Bass River. These selling points matter more than square footage.
If you're selling in West Yarmouth: You're in a strong position with +4.6% appreciation and balanced demand (7 pending on 10 active). Focus on what makes your property special—Nantucket Sound views, recent updates, rental income history, beach access. Condos need competitive pricing in the $350K-$450K range to move quickly. Single-family homes with unique features can command premiums in the $500K-$650K range. List early (February-March) to capture buyers before summer inventory floods the market.
Pricing strategy by appreciation:
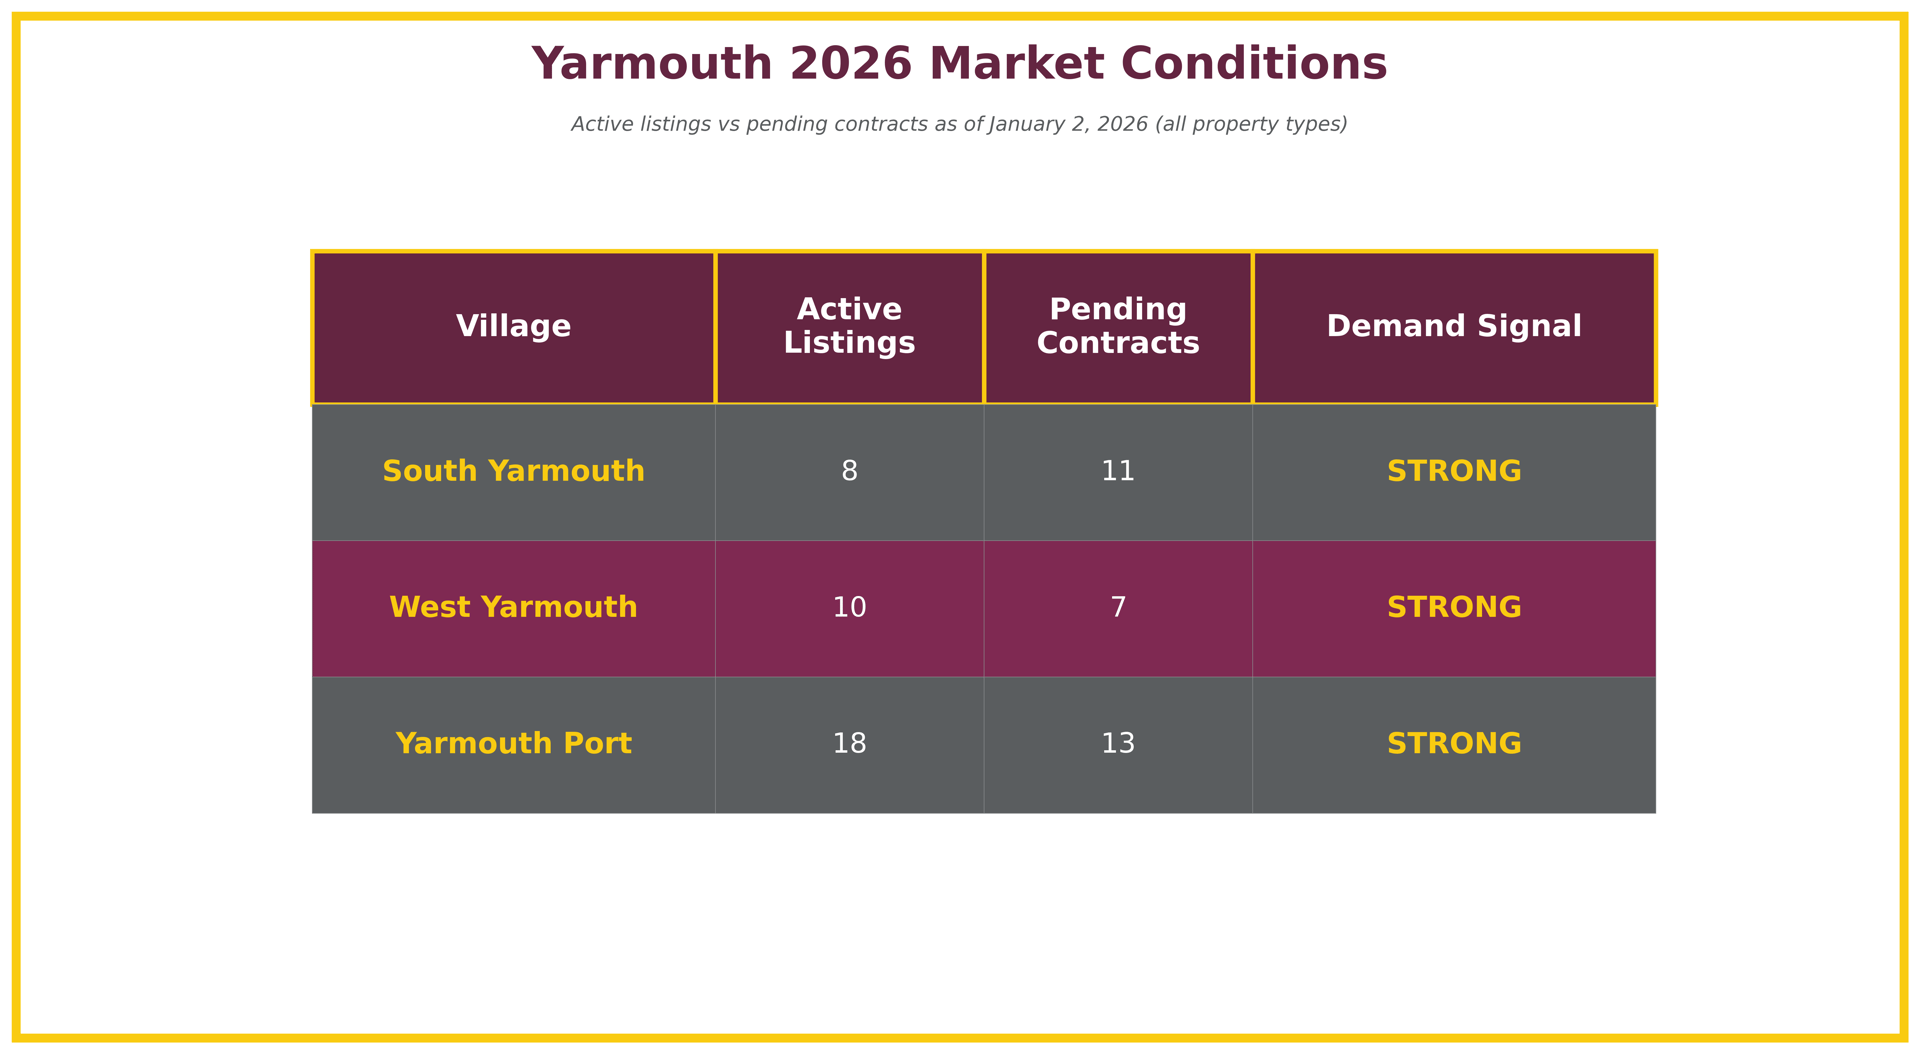
Yarmouth 2026 Market Conditions - Active vs Pending by Village as of January 6, 2026
Current market data (as of January 2, 2026) across all property types reveals strong demand signals across all three Yarmouth villages:
South Yarmouth declined -2.5% but now has the strongest demand signal (11 pending on 8 active). Buyers see value after the decline and are acting on it aggressively. This village could surprise people with strong 2026 appreciation as the market corrects. The pending-to-active ratio here is the best in Yarmouth.
West Yarmouth showed solid +4.6% appreciation and has strong balanced demand (7 pending on 10 active). This steady performer is delivering predictable returns and attracting buyers across both condos and single-family homes. The active transaction volume suggests continued market health.
Yarmouth Port led with +6.5% combined appreciation (+12.9% for single-family) and shows strong absolute demand (13 pending on 18 active). While the ratio is slightly lower than other villages, the total number of pending transactions demonstrates continued buyer interest at all price points from condos to premium homes.
The takeaway: all three villages show healthy demand heading into 2026. South Yarmouth's rebound potential is the most compelling story, West Yarmouth offers steady reliability, and Yarmouth Port maintains premium status despite building inventory.
Here's what the data is telling us as we head into the new year:
Yarmouth's 2025 patterns show a market where premium villages commanded significant premiums across all property types. Yarmouth Port's +6.5% combined appreciation (+12.9% for single-family) proves buyers will pay for Route 6A character and Cape Cod Bay proximity. West Yarmouth's solid +4.6% gain shows accessible beach access maintains strong, steady demand across both condos and homes.
The overall picture shows a remarkably stable market. Yarmouth saw 416 sales in 2025 versus 417 in 2024—essentially flat total activity that suggests the market found equilibrium. Single-family sales declined 3.4% (317 versus 328), but this was offset by steady condo activity, particularly in West Yarmouth where condo sales helped drive appreciation.
As we move into 2026, expect South Yarmouth to lead appreciation as buyers recognize the value opportunity after the -2.5% decline—current pending activity strongly supports this. West Yarmouth will likely continue its steady, reliable performance attracting buyers who want balance between value and location. Yarmouth Port will maintain premium status, with single-family homes continuing to outperform condos in appreciation.
The data shows where values grew and declined in 2025 across both homes and condos. Now it's about positioning yourself—whether you're buying or selling—to capitalize on where the market is heading in 2026, not where it's been.
Q: Why did Yarmouth Port appreciate +6.5% while South Yarmouth declined -2.5%?
A: Yarmouth Port's historic village character, proximity to Route 6A, and limited inventory created stronger demand. South Yarmouth's larger housing stock and more affordable price points made it more sensitive to buyer budget constraints. The 9-point spread shows why analyzing by village matters—buying in "Yarmouth" means very different things depending on which village.
Q: Should I combine single-family and condo data, or look at them separately?
A: Both perspectives matter. Combined data shows the full market and what's actually happening to the median home price in each village. But property type mix can influence those medians significantly. In Yarmouth Port, the +6.5% combined appreciation was pulled down from the +12.9% single-family appreciation due to condo sales. Always look at both to understand the complete picture.
Q: Is West Yarmouth's +4.6% appreciation sustainable in 2026?
A: West Yarmouth's strong sales volume increase (132→154 sales) combined with steady appreciation suggests healthy fundamentals. Current market conditions show 10 active listings with 7 pending, indicating continued demand. However, spring inventory levels will determine whether 2025's momentum continues—if 20-30 more listings hit in March-April, appreciation could moderate.
Q: South Yarmouth declined -2.5%—should I avoid buying there?
A: Not necessarily. The -2.5% decline represents a modest price correction, and current demand signals are STRONG (8 active, 11 pending). This could be a value opportunity for buyers who want Yarmouth access at South Yarmouth price points. For sellers, it means pricing at or slightly below the $595,000 median to capture that demand.
Q: How current is this Yarmouth analysis?
A: This analysis was completed January 7, 2026, using complete calendar year 2025 MLS data (416 total sales). Active and pending inventory reflects early January 2026 conditions—a snapshot that will evolve significantly as spring inventory arrives. Market patterns observed in 2025 may shift in 2026 based on inventory levels and buyer demand through the critical March-June selling season.
The numbers tell one story—but your specific situation tells another. Whether you're eyeing Yarmouth Port's historic charm, South Yarmouth's beach access value, or West Yarmouth's family-friendly stability, the right strategy depends on more than just appreciation rates.
If you're buying: The data shows where homes gained value in 2025 and where demand is strong in 2026, but your ideal village depends on things appreciation rates can't measure—like whether you want Route 6A walkability, Nantucket Sound beaches, or Bass River kayaking. Let's talk about what matters to you. I'll show you what's actually available right now in each village, explain which ones have momentum heading into 2026, help you understand where you'll get the most value for your budget, and position you to make your strongest offer when the right property appears.
If you're selling: Your home's potential depends on which village you're in, what condition it's in, when you list, and how you price it relative to current market conditions—not last year's peak. I'll walk through your property, explain what buyers in your village are looking for right now based on actual pending activity, suggest updates that actually add value (and which ones don't pay off), help you price it to sell at the number you need while positioning it competitively, and create a marketing strategy that highlights what makes your property special in a market with choices.
Let's turn these appreciation insights and market condition signals into a strategy that works for your specific situation—whether you're buying your first Yarmouth home or selling a property you've owned for decades.
Call me at 508-335-3875, email me at [email protected], or reach out through my website anytime. I'm here to help you make sense of Yarmouth's village markets and position yourself for success in 2026.
ABOUT DEBORAH CAMUSO
Deborah Camuso is a Cape Cod real estate broker with 25+ years of experience and direct access to Barnstable County MLS data. She specializes in hyperlocal village-level market analysis across all 15 Cape Cod towns and has analyzed over 10,000 Cape Cod property transactions. Her Camuso Village-Level Analysis methodology examines sales within village boundaries rather than town-wide averages, revealing micro-market patterns that help buyers and sellers make data-driven decisions. Her market reports are used by buyers, sellers, and investors across Cape Cod.
Contact: [email protected] | 508-335-3875 | debcamuso.com
Analysis based on MLS closed sales data for Yarmouth properties (single-family homes and condos combined), January 1 - December 31, comparing 2024 and 2025 performance. Median prices, sales volume, and market condition figures derived from actual transaction records across all property types. Market insights reflect patterns observed across 416 closed sales in 2025 compared to 417 in 2024. Single-family specific performance noted where relevant. Active and pending inventory data reflects market conditions as of January 2, 2026.


Deborah would love an opportunity to talk with you and show you why it would be a benefit to work with her. In a world full of uncertainty, she will guide you in the correct direction and ensure that you make the most confident decisions. Connect with Deborah - She is here to offer insight and support whenever you are ready.
Work With Deborah