Cape Cod Real Estate 2026: The Brutal 15-Town Truth—12.4% Spread Between Winners and Losers, Where You Strike Now
After analyzing every closed sale across all 15 Cape Cod towns in 2025—6,547 transactions totaling over $6.2 billion—Deborah Camuso discovered a brutal 12.4 percentage point spread between the biggest winners (Wellfleet +8.4%) and biggest losers (Harwich -4.0%), revealing exactly which markets crushed it, which got crushed, and where smart buyers and sellers make their move in 2026.
QUICK DATA: Cape Cod Real Estate 2025
Market Overview:
Complete 15-Town Rankings:
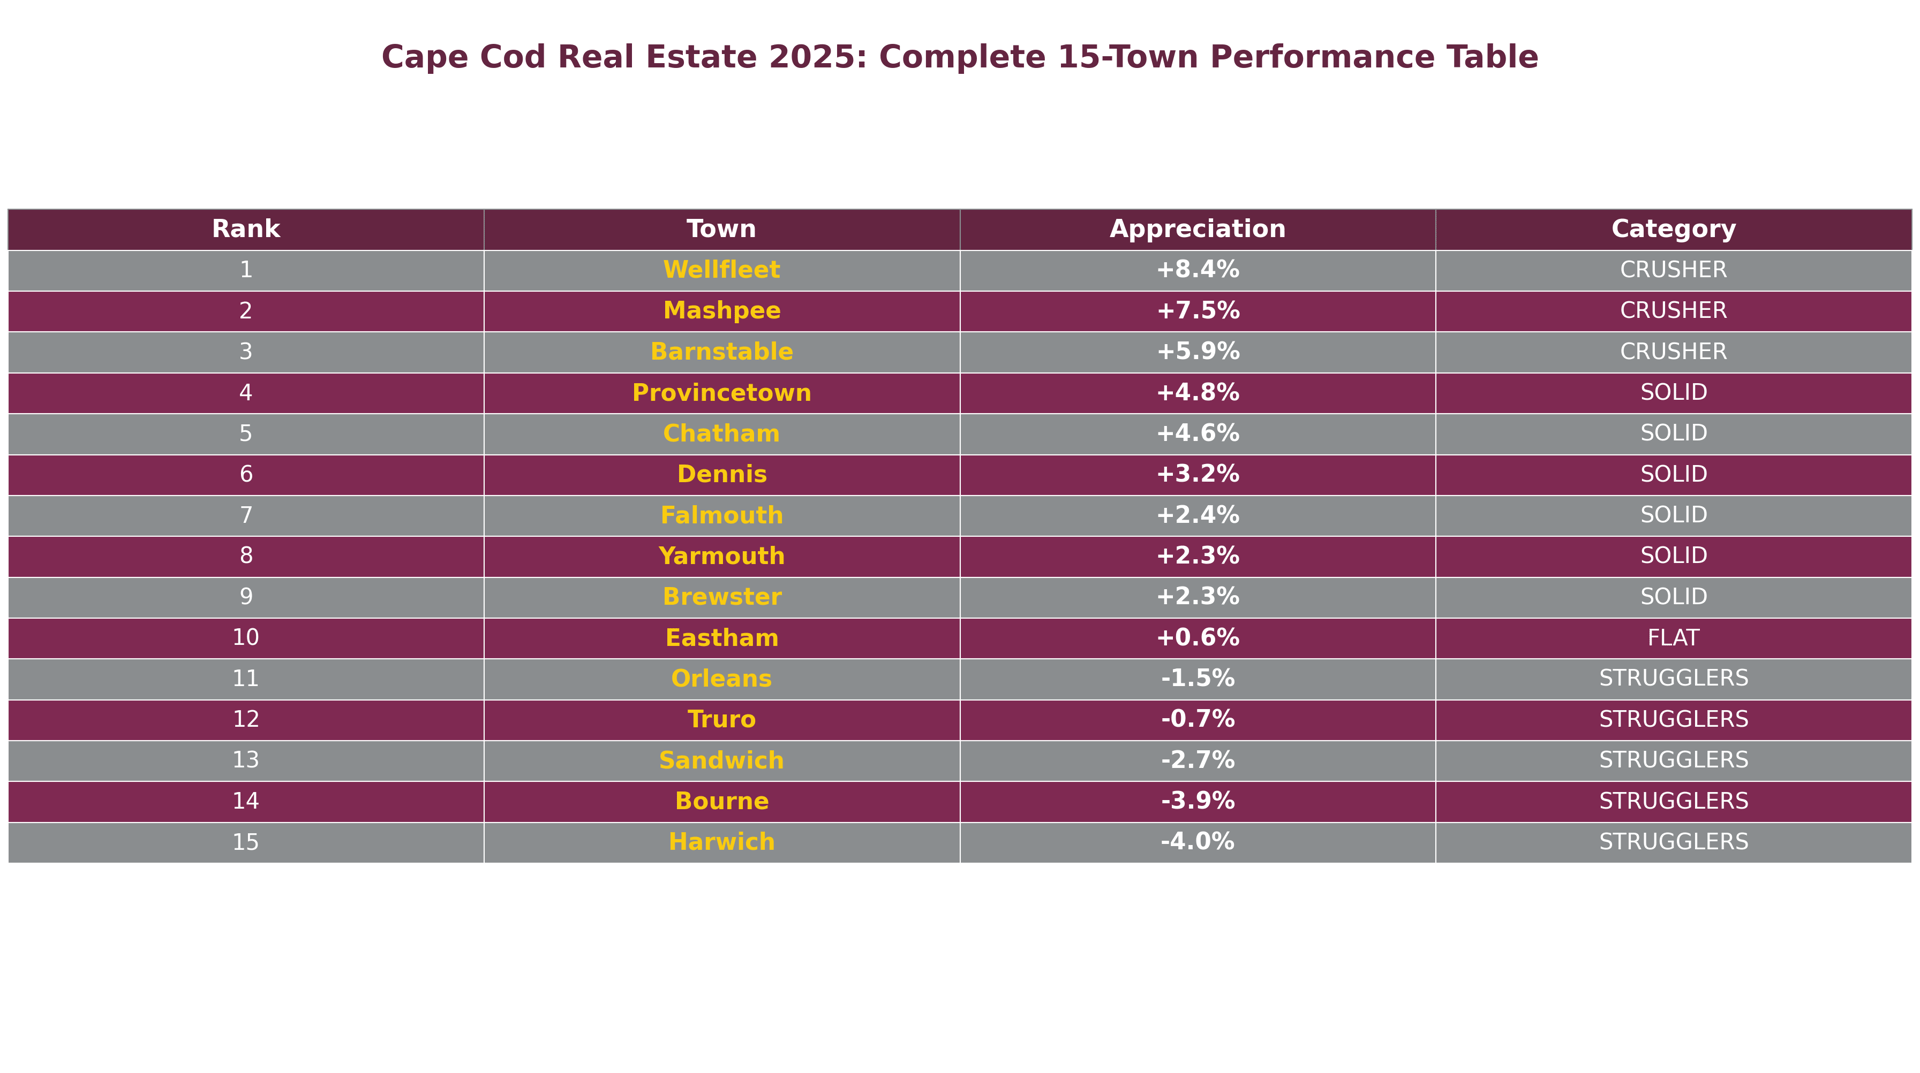
| Rank | Town | 2025 Appreciation | Market Category |
|---|---|---|---|
| 1 | Wellfleet | +8.4% | CRUSHER |
| 2 | Mashpee | +7.5% | CRUSHER |
| 3 | Barnstable | +5.9% | CRUSHER |
| 4 | Provincetown | +4.8% | SOLID |
| 5 | Chatham | +4.6% | SOLID |
| 6 | Dennis | +3.2% | SOLID |
| 7 | Falmouth | +2.4% | SOLID |
| 8 | Yarmouth | +2.3% | SOLID |
| 9 | Brewster | +2.3% | SOLID |
| 10 | Eastham | +0.6% | FLAT |
| 11 | Orleans | -1.5% | STRUGGLERS |
| 12 | Truro | -0.7% | STRUGGLERS |
| 13 | Sandwich | -2.7% | STRUGGLERS |
| 14 | Bourne | -3.9% | STRUGGLERS |
| 15 | Harwich | -4.0% | STRUGGLERS |
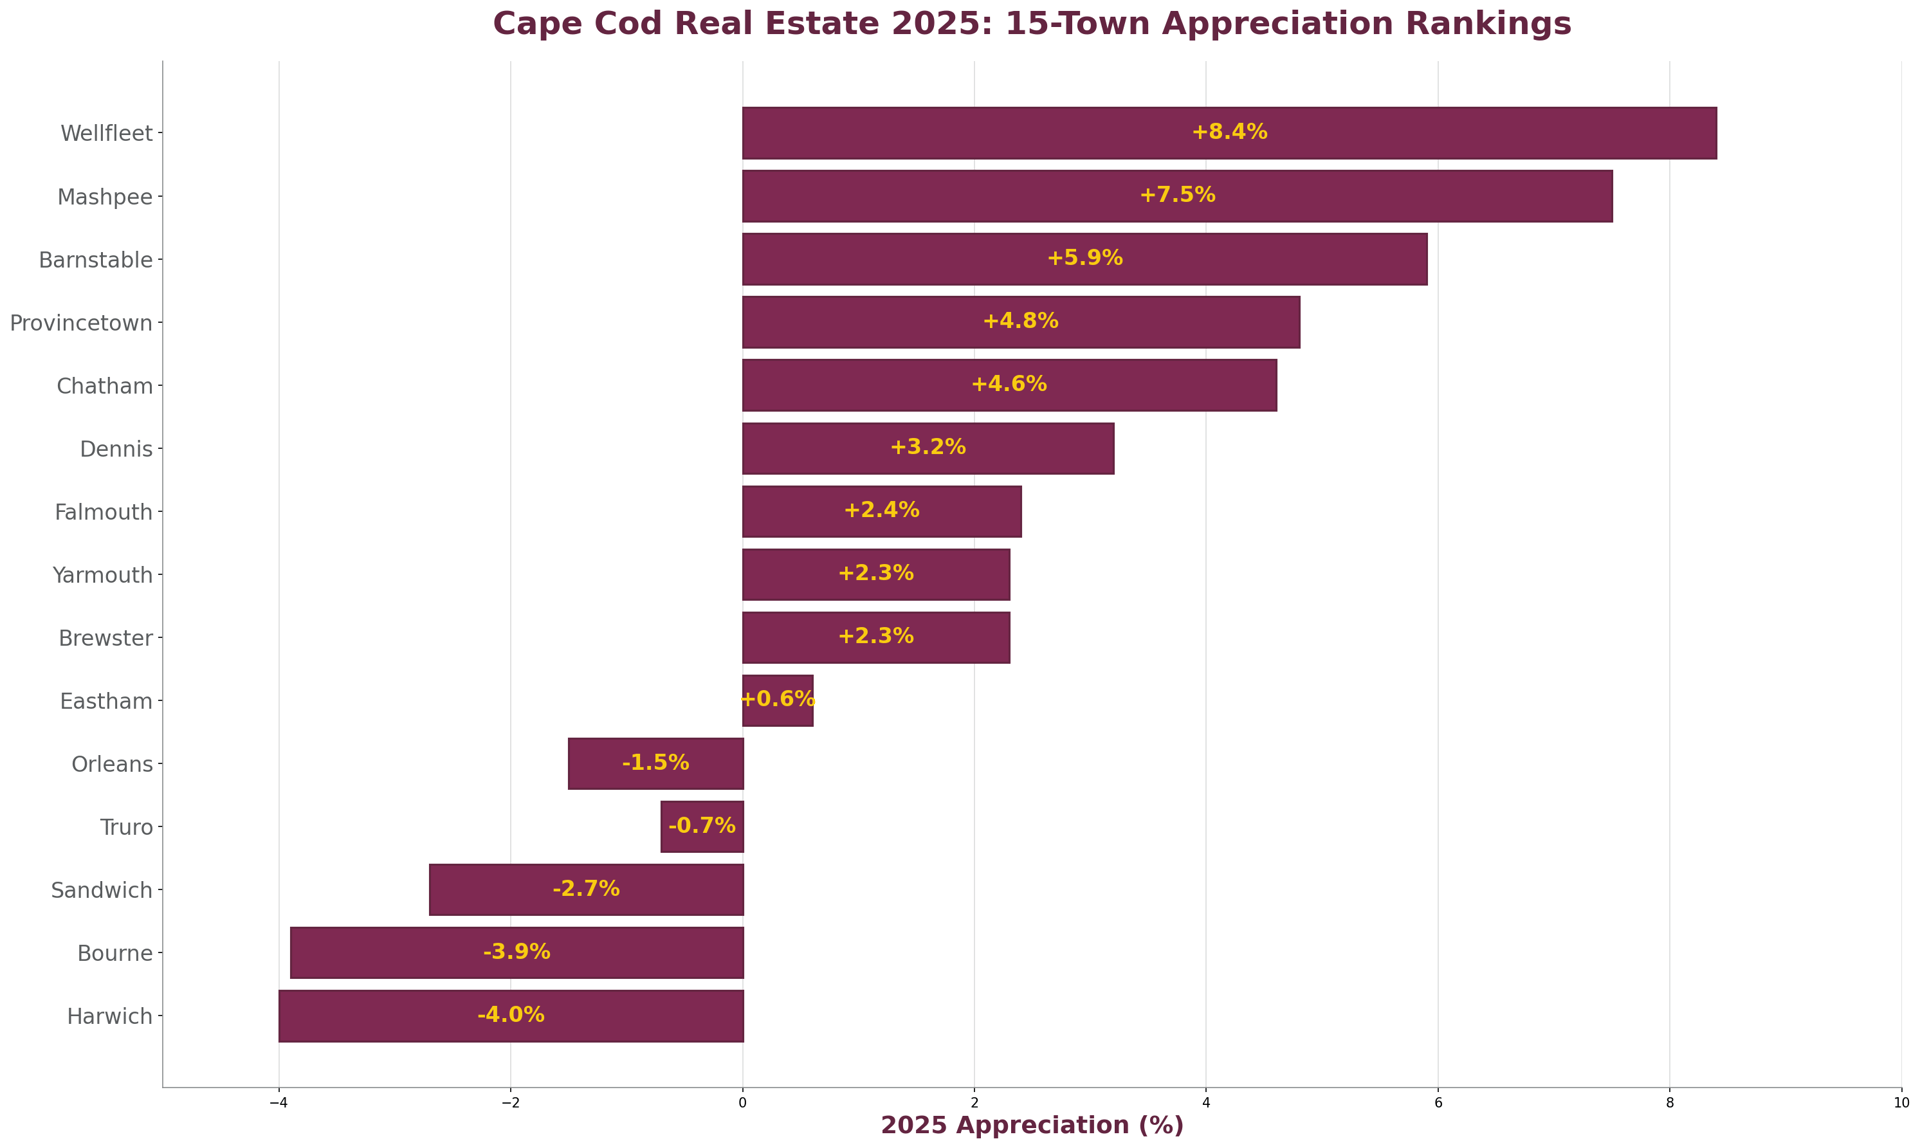
As of January 2026, Deborah Camuso's comprehensive analysis of Cape Cod's real estate market reveals the brutal truth: where you bought in 2025 determined whether you made serious money or watched equity disappear. The 12.4 percentage point spread between Wellfleet's +8.4% surge and Harwich's -4.0% decline represents the most dramatic performance gap across Cape Cod towns in over a decade—and it's exactly the intelligence buyers and sellers need to dominate 2026.
Here's what that spread means in real dollars: A buyer who purchased a $750,000 property in Wellfleet gained $63,000 in equity in one year. That same buyer choosing Harwich lost $30,000. That's a $93,000 swing based purely on town selection. Same year. Same market conditions. Same Cape Cod. Completely different financial outcomes.
Deborah Camuso analyzed every transaction across all 15 Cape Cod towns—6,547+ closed sales representing over $6.2 billion in real estate activity—to identify not just which markets won and lost, but why they performed so differently and what that means for buyers and sellers making decisions in 2026.
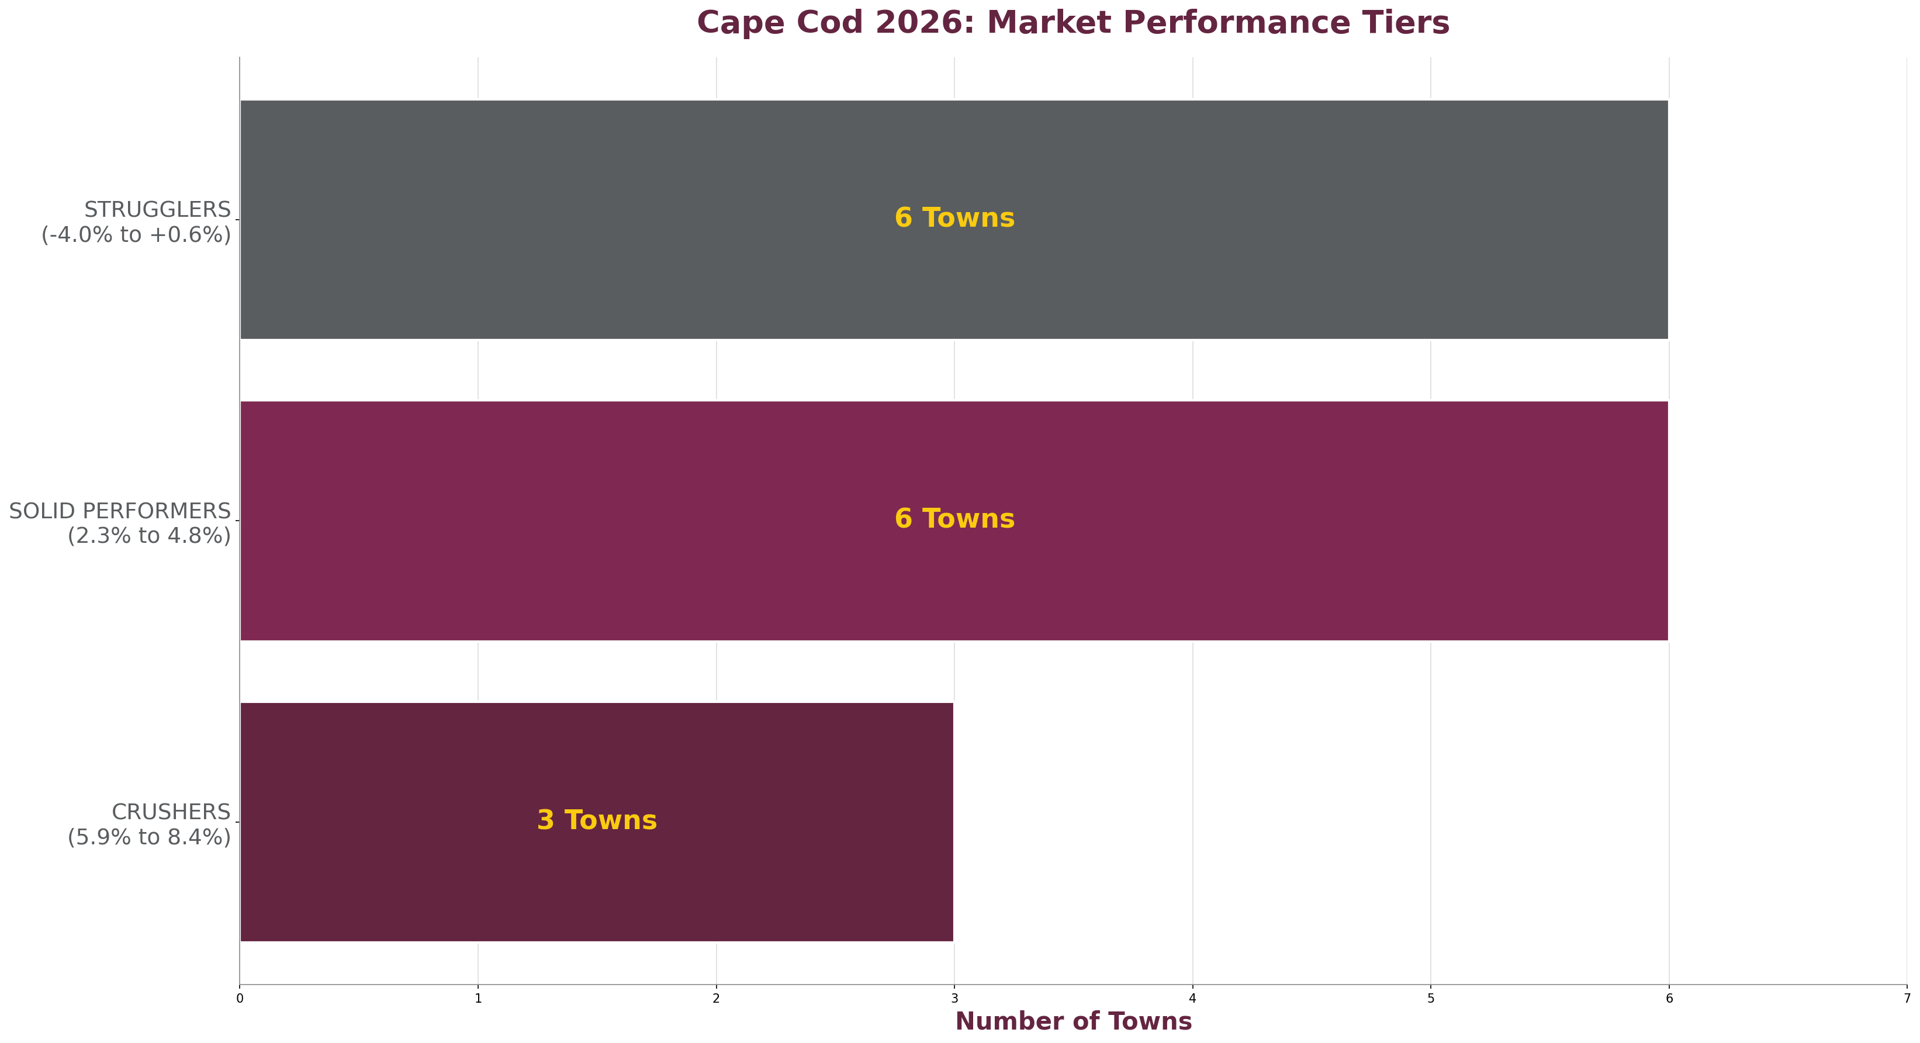
The performance tiers tell the complete story:
CRUSHERS (5.9% to 8.4% gains): Wellfleet, Mashpee, Barnstable—these three towns delivered exceptional returns, with buyers earning $44,250 to $63,000 on median purchases. Limited inventory, strong fundamentals, and buyer conviction created appreciation that outpaced most Cape markets.
SOLID PERFORMERS (2.3% to 4.8% gains): Provincetown, Chatham, Dennis, Falmouth, Yarmouth, Brewster—six towns that delivered steady, sustainable appreciation without speculation or volatility. Buyers earned $17,250 to $36,000 on median purchases while maintaining market stability.
FLAT/STRUGGLING (-4.0% to +0.6%): Eastham stayed essentially flat, while Orleans, Truro, Sandwich, Bourne, and Harwich declined, with sellers losing $7,500 to $30,000 on median properties. Market corrections, inventory pressures, or buyer resistance created headwinds that smart 2026 buyers can exploit.
Cape Cod 15-Town Appreciation Bar Chart
Wellfleet didn't just win 2025—it crushed the competition with +8.4% appreciation that rewarded every buyer who had the intelligence to recognize Outer Cape value before it exploded. Deborah Camuso's analysis shows Wellfleet buyers gained a median $63,000 on $750,000 purchases, outperforming every other Cape Cod town by significant margins.
What drove Wellfleet's dominance:
The 8.4% appreciation demonstrates Wellfleet's transition from "hidden gem" to established luxury market. Buyers who recognized this value in 2025 positioned themselves perfectly—those waiting for "better deals" watched prices climb beyond reach.
2026 implications: Wellfleet's +8.4% appreciation likely moderates, but the fundamentals (scarcity, culture, conservation) remain intact. Buyers should expect continued strength with more selective inventory and premium pricing.
Mashpee delivered +7.5% appreciation that proved Upper Cape affordability doesn't mean sacrificing returns. Deborah Camuso's data shows Mashpee buyers gained a median $56,250 on $750,000 purchases, demonstrating that buyers seeking value relative to Falmouth and Sandwich found exceptional opportunities.
What powered Mashpee's surge:
The 7.5% gain reflects buyers discovering that Mashpee delivers Cape lifestyle at price points 15-25% below neighboring towns. Smart money recognized this arbitrage opportunity and acted on it.
2026 implications: Mashpee's value positioning remains compelling if pricing doesn't overshoot fundamentals. Expect continued buyer interest from those priced out of Falmouth and Sandwich.
Barnstable's +5.9% appreciation across its 10 distinct villages proved that diversity creates stability. With buyers gaining a median $44,250 on $750,000 purchases, Barnstable demonstrated how comprehensive amenities—from Hyannis commercial center to Osterville waterfront luxury—attract buyers across all demographics.
What drove Barnstable's strength:
Barnstable's 5.9% gain across such diverse inventory demonstrates market health rather than speculation. This wasn't one hot neighborhood—it was systematic appreciation across multiple villages.
2026 implications: Barnstable's diversified village portfolio should continue providing opportunities across price ranges, with village-specific performance varying by local supply and demand dynamics.
Provincetown (+4.8%), Chatham (+4.6%), Dennis (+3.2%), Falmouth (+2.4%), Yarmouth (+2.3%), Brewster (+2.3%)
These six towns provided steady, sustainable appreciation without the volatility that can signal speculation bubbles. Buyers earned $17,250 to $36,000 on median purchases while maintaining market stability that supports long-term wealth building.
Why solid performers offer the best risk-adjusted returns:
Provincetown and Chatham commanded premiums reflecting luxury positioning, while Dennis, Falmouth, Yarmouth, and Brewster delivered value-conscious appreciation that proves you don't need to pay ultra-premium prices to build wealth in Cape Cod real estate.
Complete Cape Cod Performance Table 2025
The brutal truth: Five Cape Cod towns delivered negative returns in 2025, with sellers losing $7,500 to $30,000 on median properties. Understanding why these markets struggled—and whether they represent value opportunities or continued weakness—determines whether contrarian buyers profit or get crushed in 2026.
Harwich and Bourne buyers watched $30,000+ disappear from median home equity, representing the worst performance across all Cape Cod towns. But the story behind these declines reveals opportunity for strategic 2026 buyers who understand the difference between temporary corrections and fundamental weakness.
Harwich's -4.0% decline masks dramatic village-level opportunity: Analyzing Harwich's individual villages reveals a 46.2-point spread that town-wide statistics completely miss. West Harwich surged +28.1% while Harwich Port declined -18.1%, proving that blanket assumptions about "Harwich" miss the real story. Smart buyers focusing on West Harwich's value positioning versus Harwich Port's correction could exploit this village-level arbitrage.
Bourne's -3.9% represents Upper Cape recalibration: Bourne's decline reflects pricing that exceeded buyer willingness to pay for Upper Cape location without premium amenities. The correction brought Bourne back to levels where value-conscious buyers can access Cape Cod ownership without Sandwich or Falmouth premiums.
These three towns experienced modest corrections that may represent buying opportunities rather than fundamental weakness.
Sandwich (-2.7%): Village-level analysis shows Forestdale actually gained +12.2% while East Sandwich declined -15.4%, creating opportunities for buyers who understand village dynamics rather than town-wide averages.
Orleans (-1.5%): Lower Cape premium positioning with year-round infrastructure suggests the modest decline could represent entry opportunity for buyers seeking established amenities at temporarily reduced pricing.
Truro (-0.7%): Outer Cape location with limited inventory means the small decline likely reflects individual transaction mix rather than systematic weakness.
Deborah Camuso's analysis of 6,547+ transactions reveals four critical factors that separated winning markets from losing ones—and why understanding these dynamics positions buyers and sellers for 2026 success.
Factor #1: Inventory Scarcity vs. Oversupply Winner markets (Wellfleet, Mashpee, Barnstable) maintained limited inventory relative to buyer demand, creating competitive conditions that drove prices higher. Loser markets experienced inventory increases or buyer demand decreases, giving purchasers negotiating leverage and forcing seller price concessions.
Factor #2: Buyer Profile Match vs. Mismatch
Towns that attracted buyers whose financial profiles matched pricing levels (Provincetown luxury buyers, Mashpee value buyers) performed well. Towns where pricing exceeded target buyer capacity (some Harwich villages, Bourne premium properties) corrected as buyers walked away.
Factor #3: Unique Selling Proposition vs. Commodity Positioning Markets with distinctive attributes (Wellfleet's art scene, Chatham's luxury reputation, Barnstable's village diversity) commanded premiums. Towns positioned primarily as "cheaper alternatives" to other markets struggled to justify pricing power.
Factor #4: Infrastructure and Services vs. Limited Amenities Towns with comprehensive year-round services, healthcare, retail, and employment (Barnstable, Falmouth) attracted diverse buyer bases. Towns heavily dependent on seasonal tourism or lacking infrastructure faced buyer skepticism about long-term value.
Your 2026 buying strategy depends on whether you're targeting winning markets that require aggressive tactics, solid performers offering predictable opportunities, or struggling markets where contrarian buyers can exploit corrections.
Wellfleet, Mashpee, Barnstable
These three markets crushed 2025 performance and likely maintain momentum into 2026. Buyers should expect:
Budget Requirements:
Strategy: Get pre-approved for 20% over your target range, tour properties within 24 hours of listing, make competitive offers without lowball tactics. These markets reward buyers who act decisively, not those seeking bargains.
Provincetown, Chatham, Dennis, Falmouth, Yarmouth, Brewster
These six towns delivered 2.3% to 4.8% appreciation with stability that supports long-term wealth building. Buyers should expect:
Budget Requirements:
Strategy: Focus on long-term value rather than quick appreciation. These markets reward buyers seeking stable wealth building, not those chasing maximum returns.
Eastham, Orleans, Truro, Sandwich, Bourne, Harwich
Five markets declined while one stayed flat, creating opportunities for buyers who understand the difference between temporary corrections and permanent weakness.
The contrarian opportunity: Properties that lost 1.5% to 4.0% value may represent buying opportunities if fundamentals remain sound. Buyers willing to hold 3-5 years could profit from market reversions.
The contrarian risk: Some declines may signal permanent shifts in buyer preferences or fundamental problems. Buyers could catch falling knives rather than bargains.
Strategy by specific market:
Orleans (-1.5%): Lower Cape infrastructure with modest correction suggests value opportunity for buyers seeking established amenities at reduced pricing.
Harwich (-4.0%): Focus on village-level analysis rather than town-wide decline. West Harwich's +28.1% performance versus Harwich Port's -18.1% decline creates specific opportunities and risks.
Sandwich/Bourne (-2.7% to -3.9%): Upper Cape corrections may represent entry points for buyers seeking Cape access below Falmouth pricing, but demand fundamental analysis of why buyers retreated.
Your 2026 selling strategy depends entirely on whether you're in a winning market with pricing power or a struggling market requiring strategic positioning.
Wellfleet (+8.4%), Mashpee (+7.5%), Barnstable (+5.9%)
You're selling from strength. The 5.9% to 8.4% appreciation backing your market position means buyers expect to pay competitive prices for quality properties.
Pricing Strategy: List at or within 3-5% of recent comparable sales (last 90 days). Don't test the market 15% above comps hoping for "the right buyer"—even strong markets have limits.
Timing Strategy: List March-May to capture spring buyer surge before summer inventory floods the market. Your market strength won't last forever if supply increases dramatically.
Positioning Strategy: At post-appreciation pricing levels, buyers expect perfection. Invest in staging, professional photography, and address deferred maintenance. You're competing with other sellers in winning markets for selective buyers.
Provincetown (+4.8%), Chatham (+4.6%), Dennis (+3.2%), Falmouth (+2.4%), Yarmouth (+2.3%), Brewster (+2.3%)
You have moderate appreciation backing your position, but buyers aren't desperate. Success requires competitive pricing and strategic positioning.
Pricing Strategy: Price at recent comparable sales, not 2024 peaks or aspirational values. The 2.3% to 4.8% appreciation provides cushion but won't support significant overpricing.
Market Positioning: Emphasize what makes your property special within your town's market. Generic listings get lost; distinctive properties command premiums.
Timeline Expectations: Plan for 30-60 days on market for correctly priced properties. Overpricing by 10%+ adds 60-90 days and forces eventual reductions below optimal starting price.
Eastham (+0.6%), Orleans (-1.5%), Truro (-0.7%), Sandwich (-2.7%), Bourne (-3.9%), Harwich (-4.0%)
You're selling into headwinds. Recent performance ranging from flat to -4.0% means buyers expect value positioning, not premium pricing.
Critical decision: Price aggressively at or below recent comparable sales for quick transaction, or hold 18-24 months betting on market recovery.
If selling now: Price at recent sales levels (last 90 days) and prepare for negotiations. Buyers in your markets have leverage and will use it.
If holding: Understand you're speculating on recovery versus taking current market reality. Monitor spring 2026 inventory levels and buyer activity to determine if conditions improve or deteriorate further.
Village-level opportunities: In towns like Harwich with dramatic village performance spreads, position based on your specific village rather than town-wide statistics. West Harwich sellers price differently than Harwich Port sellers.
Need personalized pricing strategy for your specific property and market? Call me at 508-335-3875 or email [email protected] for a free comparative market analysis showing exactly what sold in your area and what pricing approach gives you the best outcome.
As of January 2026, analyzing the brutal 12.4% performance spread between winning and losing Cape Cod markets, several patterns emerge that shape 2026 expectations:
CRUSHER markets (Wellfleet, Mashpee, Barnstable) likely moderate but maintain strength. The 5.9% to 8.4% appreciation reflects genuine demand meeting limited supply rather than speculation bubbles. Expect continued buyer interest with more selective pricing—gains may moderate to 3-6% annually but fundamentals remain intact.
SOLID PERFORMERS likely continue steady appreciation. Towns delivering 2.3% to 4.8% gains demonstrated sustainable growth patterns. These markets should provide predictable 2-5% annual appreciation without dramatic volatility—ideal for buyers seeking stable wealth building.
STRUGGLING markets face critical 2026 test. Towns with flat to -4.0% performance need spring inventory and buyer activity to determine whether 2025 represented temporary corrections or permanent buyer preference shifts. Recovery requires demonstrating value at current pricing levels.
The broader pattern: Cape Cod's market increasingly rewards unique positioning over generic coastal location. Towns and villages with distinctive attributes (culture, amenities, scarcity, infrastructure) command premiums while those competing primarily on price face buyer skepticism.
Rate environment impact: If mortgage rates decline to 6-6.5% from current 7%+ levels, expect enhanced buyer activity in all markets but disproportionate benefits to CRUSHER markets where affluent buyers have been waiting for financing cost relief.
Cape Cod Market Tiers Comparison 2026
Cape Cod's 12.4% performance spread between winning and losing markets far exceeds national real estate volatility, demonstrating why local expertise matters more than national economic predictions for buyers and sellers making 2026 decisions.
National Context:
Cape Cod outperformed and underperformed simultaneously:
What this reveals: Cape Cod operates as a luxury secondary market where buyer selectivity creates dramatic winners and losers rather than uniform performance. National housing trends provide little guidance for specific Cape Cod town selection—local market intelligence determines success or failure.
Investment implications: Buyers treating Cape Cod as generic vacation market miss opportunities and risks. Those understanding town-specific dynamics exploit inefficiencies others ignore.
Q: Why did some Cape Cod towns gain 8.4% while others lost 4.0%?
A: Cape Cod buyers became dramatically more selective in 2025, rewarding towns with unique attributes (Wellfleet's art scene, Mashpee's value positioning, Barnstable's village diversity) while punishing generic coastal locations lacking distinctive selling propositions. The 12.4% spread reflects buyer sophistication, not random market movements.
Q: Should I buy in winning markets like Wellfleet after 8.4% appreciation, or target struggling markets like Harwich for value?
A: Depends on timeline and risk tolerance. Wellfleet's +8.4% reflects structural advantages (scarcity, culture, conservation) likely to persist—buyers seeking stability pay premiums for established winners. Harwich's -4.0% could represent correction or continued decline—contrarian buyers profit if they're right about recovery but lose more if they're wrong. Match strategy to your conviction and holding period.
Q: How current is this 15-town ranking analysis?
A: This analysis was completed January 2026 using complete calendar year 2025 MLS data across all 15 Cape Cod towns. The 12.4% performance spread and town rankings represent actual closed sales, not projections. However, 2026 performance depends on inventory levels, interest rates, and buyer demand that may differ from 2025 patterns.
Q: Is Deborah Camuso's village-level analysis more accurate than town-wide statistics?
A: Absolutely. Town-wide statistics mask dramatic village performance differences that determine actual buyer outcomes. For example, Harwich's -4.0% town-wide decline hides West Harwich's +28.1% surge versus Harwich Port's -18.1% collapse. Buyers making decisions based on town-wide data miss opportunities and risks that village-level analysis reveals.
Q: Which Cape Cod towns offer the best value for 2026 buyers?
A: "Value" depends on what you prioritize. For appreciation potential: target CRUSHER markets if you can afford competition. For stability: choose SOLID PERFORMERS offering predictable returns. For contrarian opportunity: select STRUGGLING markets only if you believe specific towns corrected too far and will recover. No single "best value" exists—optimal choice matches your budget, timeline, and risk tolerance.
Q: Should I wait for interest rates to drop before buying Cape Cod real estate?
A: Rate timing strategy often backfires. If rates drop significantly, buyer competition increases across all markets, potentially pushing prices up enough to offset financing savings. Cape Cod's affluent buyer base uses significant cash, making them less rate-sensitive than typical homebuyers. Focus on finding the right property at current pricing rather than speculating on rate movements.
The 12.4% spread between Cape Cod's winning and losing markets isn't random—it's the direct result of buyer selectivity, market fundamentals, and positioning that smart money recognized while others missed. Whether you're targeting CRUSHER markets that dominated 2025, SOLID PERFORMERS offering predictable returns, or STRUGGLING markets with contrarian opportunity, success demands strategy based on actual data, not assumptions.
Here's what you get when you work with me:
Complete Market Intelligence: I analyze every sale in all 15 Cape Cod towns, breaking down performance by village, property type, and price tier rather than relying on generic market averages that miss the real opportunities.
Strategic Positioning: Whether you're buying in Wellfleet's hot market or selling in Harwich's correction, I position you based on actual market dynamics, not outdated strategies or generic real estate advice.
Local Expertise That Matters: 25+ years of Cape Cod experience means I know which villages outperform within each town, which property types offer best value, and which market signals predict future performance.
Data-Driven Decisions: Every recommendation backs up with MLS analysis, comparable sales, and market intelligence you can't get from agents who "cover" Cape Cod without understanding village-level dynamics.
If you're ready to make your Cape Cod move based on the same analysis that revealed the 12.4% spread between winners and losers, let's talk. Call me at 508-335-3875, email [email protected], or visit debcamuso.com.
I'm here to help you strike in the right market at the right time—whether that means competing in winning markets, finding value in solid performers, or exploiting opportunities in correcting markets. The brutal truth about Cape Cod's 2025 performance gives us the roadmap for your 2026 success.
ABOUT DEBORAH CAMUSO
I've been analyzing Cape Cod real estate for over 25 years, and I've never seen a performance spread as dramatic as 2025's 12.4% gap between winning and losing markets. With direct MLS access across all 15 Cape towns, I analyze every sale to understand what's really happening at the village level—not just town-wide averages that miss the whole story. I've personally walked through thousands of Cape properties, from Sandwich to Provincetown, and analyzed over 10,000 transactions to understand what separates winning markets from losing ones. Whether you're buying your first Cape home or selling a property after watching your market crush it or get crushed, I'm here to help you make the smartest decision based on real data and local expertise that can't be faked.
Let's talk: [email protected] | 508-335-3875 | debcamuso.com
Analysis based on MLS closed sales data for all 15 Cape Cod towns (single-family homes and condos), January 1 - December 31, 2025, representing 6,547+ transactions across Wellfleet, Mashpee, Barnstable, Provincetown, Chatham, Dennis, Falmouth, Yarmouth, Brewster, Eastham, Orleans, Truro, Sandwich, Bourne, and Harwich. Median prices, appreciation percentages, and market rankings derived from actual transaction records. Market insights reflect patterns observed across complete calendar year 2025 performance. Town rankings based on combined single-family and condominium appreciation where data available. This analysis was completed January 2026 and reflects market conditions as of that date.


Deborah would love an opportunity to talk with you and show you why it would be a benefit to work with her. In a world full of uncertainty, she will guide you in the correct direction and ensure that you make the most confident decisions. Connect with Deborah - She is here to offer insight and support whenever you are ready.
Work With Deborah