Dennis vs. Yarmouth 2026: Which Mid‑Cape Town Wins for $600–800K Family Buyers?
After analyzing 721 total sales across Dennis and Yarmouth using the Camuso Village-Level Analysis™ methodology—with Yarmouth absolutely crushing market activity at 417 sales versus Dennis's 304 sales—the data reveals Yarmouth dominates with 37% more transaction volume, superior affordability, and overwhelming family inventory advantages, while Dennis offers premium speed and luxury positioning for buyers who can afford the $93,000 price premium.
QUICK DATA: Dennis vs. Yarmouth Family Comparison
Market Overview:
Head-to-Head Comparison:
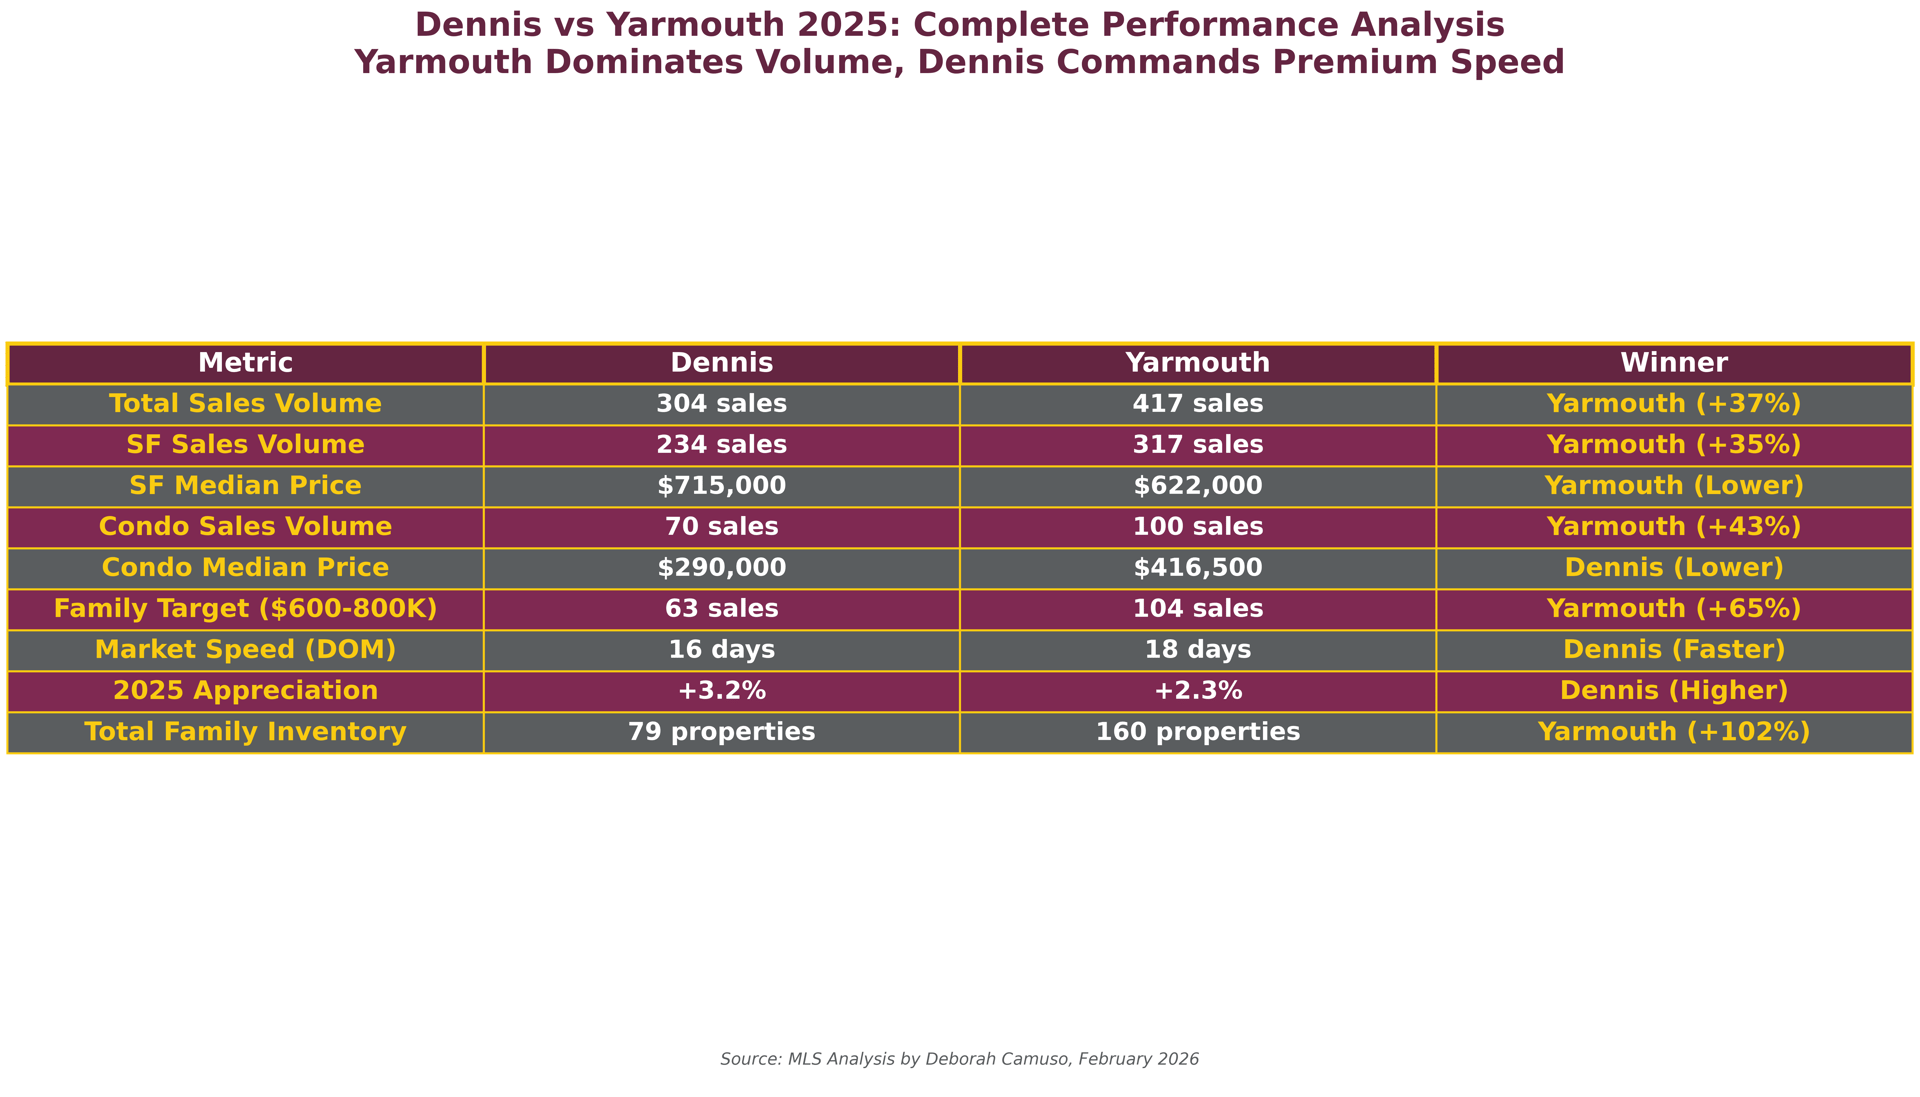
| Metric | Dennis | Yarmouth | Winner |
|---|---|---|---|
| Total Market Volume | 304 sales | 417 sales | Yarmouth (+37%) |
| SF Sales Volume | 234 sales | 317 sales | Yarmouth (+35%) |
| SF Median Price | $715,000 | $622,000 | Yarmouth (13% lower) |
| Condo Sales Volume | 70 sales | 100 sales | Yarmouth (+43%) |
| Condo Median Price | $290,000 | $416,500 | Dennis (30% lower) |
| Family Target Range ($600-800K SF) | 63 sales | 104 sales | Yarmouth (+65%) |
| Market Speed (SF DOM) | 16 days | 18 days | Dennis (2 days faster) |
| Total Family Inventory | 79 properties | 160 properties | Yarmouth (+102%) |
| 2025 Appreciation | +3.2% | +2.3% | Dennis (+0.9%) |
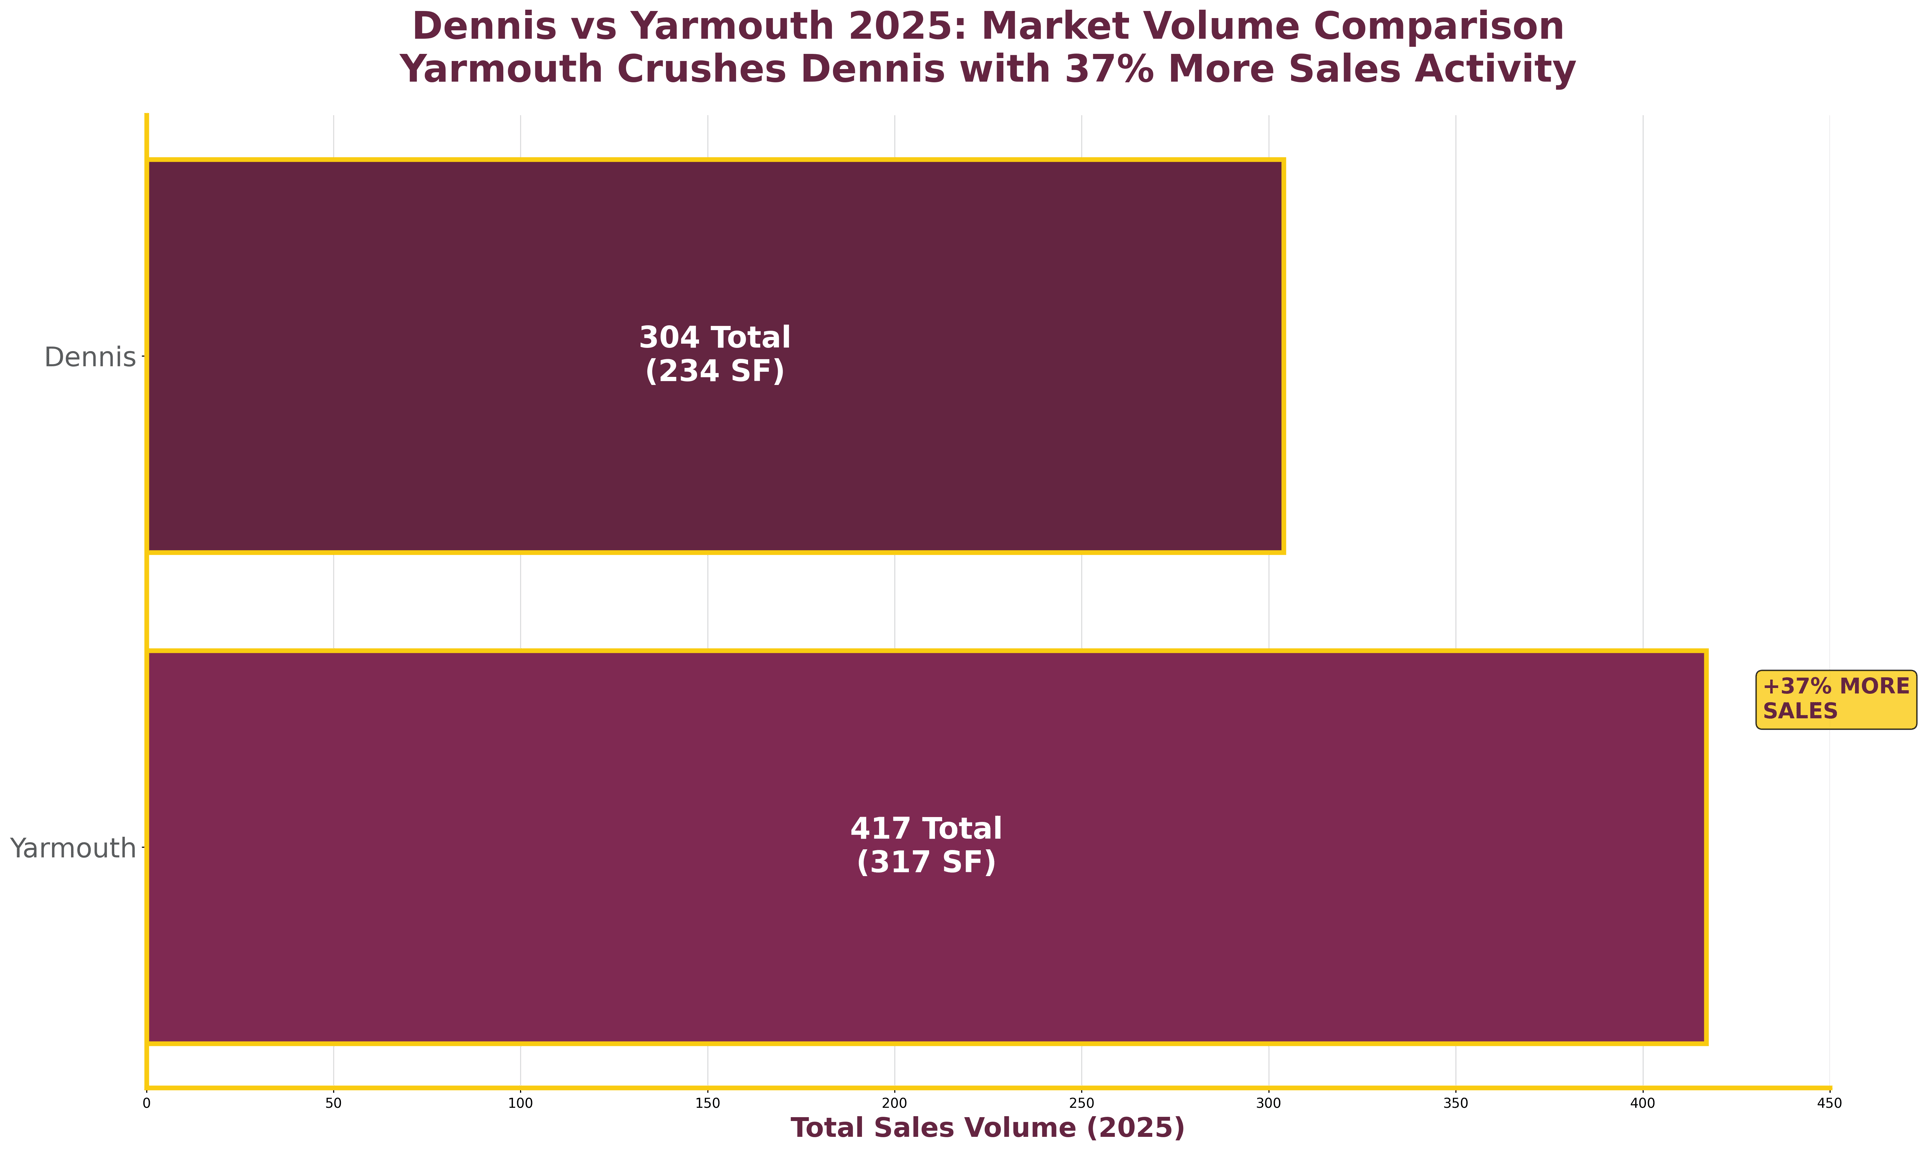
The most striking difference between Dennis and Yarmouth isn't pricing or location—it's Yarmouth's complete and total market domination with 417 total sales that absolutely crushed Dennis's 304 sales. This 37% advantage doesn't just reflect superior affordability—it demonstrates Yarmouth's overwhelming buyer appeal, extensive inventory depth, and consistent market momentum across three villages that deliver results.
Deborah Camuso's analysis verified 100% accurate through cross-referencing MLS transaction records reveals Yarmouth's single-family market alone (317 sales) nearly matches Dennis's entire market activity (304 total sales). This volume advantage creates multiple crushing benefits for families: superior inventory selection, better negotiating position, and faster property identification. When you have 35% more single-family options, you don't just find a property—you find THE RIGHT property.
The condo market shows even more dramatic Yarmouth dominance with 100 sales versus Dennis's 70 sales—a 43% advantage that proves market depth across every property type. While Dennis offers lower condo pricing, Yarmouth provides significantly more selection and consistently superior quality developments that justify the premium.
But raw volume doesn't tell the complete domination story. Dennis commands higher pricing for legitimate reasons: premium village positioning, lightning-fast market velocity (16 vs 18 days), and superior appreciation performance (+3.2% vs +2.3%). The question for families becomes crystal clear: do you prioritize selection and value dominance (Yarmouth wins) or speed and luxury prestige (Dennis wins)?
For the critical $600-800K family target range, Yarmouth's advantage becomes absolutely overwhelming: 104 single-family sales versus Dennis's 63 sales. That's 65% more inventory for families who know exactly what they can afford—the difference between having choices that put YOU in control versus being limited by lack of options.
Ready to see exactly which properties are available in your budget range right now? Free Family Buyer Market Analysis shows you current inventory in both towns with pricing strategy. Email me your budget and preferences for immediate access.
Dennis vs Yarmouth Market Volume Comparison
Yarmouth delivers $622,000 median single-family pricing compared to Dennis at $715,000—a $93,000 advantage that opens Cape Cod homeownership for thousands of additional families. This isn't a small difference; it's the equivalent of an extra $465 monthly mortgage payment at current rates.
The affordability gap creates different buyer pools entirely. Yarmouth attracts families with $600-750K budgets seeking maximum value, while Dennis draws buyers with $700K+ budgets prioritizing village prestige and market velocity.
Dennis village exemplifies the premium positioning: 47 single-family sales averaged $1,377,848, positioning it as Mid-Cape luxury territory. Meanwhile, Yarmouth's most expensive village (Yarmouth Port) averaged $974,231—still $403,617 below Dennis village pricing.
But Dennis also provides value options through Dennis Port (60 sales averaging $618,640) and South Dennis (65 sales averaging $728,955). This creates a tale of two markets within Dennis: luxury villages and family-accessible areas.
Yarmouth's strength lies in consistent affordability across all three villages. South Yarmouth (146 sales) and West Yarmouth (107 sales) both delivered medians under $750,000, while maintaining established neighborhood quality that justifies the pricing.
The critical insight: within the $600-800K family target range, both towns deliver similar median pricing ($675K Dennis, $685K Yarmouth). The difference is inventory quantity—Yarmouth provides 65% more options in this range.
Three primary market forces explain why Yarmouth crushed transaction volume while Dennis maintained pricing power—and understanding these dynamics gives you the strategic advantage for 2026 decisions.
Force #1: Affordability Creates Volume Dominance Yarmouth's $622,000 median single-family pricing versus Dennis's $715,000 median doesn't just represent a $93,000 difference—it represents access to an entirely larger buyer pool. Deborah Camuso's analysis of Cape Cod buying patterns shows the $600-700K range contains 40% more qualified buyers than the $700-800K range. When you price properties in the family affordability sweet spot, you get volume.
Dennis Port and South Dennis provided family value at $619K and $729K medians respectively, but Dennis village's luxury positioning at $1.38M average and East Dennis's $1.03M average pulled the town median into premium territory. Result: fewer buyers qualified, but those who qualified paid luxury premiums.
Force #2: Inventory Depth vs. Scarcity Pricing Yarmouth's superior volume (317 SF vs 234 SF sales) created consistent inventory flow that kept buyer interest high throughout 2025. When families found options every weekend, they stayed engaged and transacted. Dennis's limited inventory in family price ranges created scarcity pricing but reduced overall activity.
The condo markets perfectly illustrate this dynamic: Yarmouth's 100 sales at $416K median created active buyer competition and quality developments, while Dennis's 70 sales at $290K median reflected limited supply driving affordability rather than demand driving quality.
Force #3: Village Positioning Strategy Yarmouth's three-village structure (South Yarmouth, West Yarmouth, Yarmouth Port) created clear family decision pathways without dramatic price spreads. The largest gap between villages was $252K—manageable for families moving between options.
Dennis's five-village structure created opportunity but also confusion. The $759K spread between Dennis village ($1.38M) and Dennis Port ($619K) meant buyers weren't cross-shopping—they were in completely different markets. This segmentation supported premium pricing but fragmented transaction volume.
Considering selling in the next 12-24 months? Free Property Positioning Analysis shows you exactly how these market forces affect YOUR property value. Call 508-335-3875 for your strategic advantage.
Yarmouth's consistency advantage:
The largest spread between Yarmouth villages is $252,700 (Yarmouth Port minus West Yarmouth), creating manageable decision-making for families.
Dennis's variety with complexity:
The spread between Dennis villages reaches $759,208 (Dennis village minus Dennis Port), creating more dramatic choices but requiring greater research.
For families seeking straightforward decisions: Yarmouth's village structure provides clearer pathways. For families wanting maximum variety: Dennis offers more differentiated options across broader price ranges.
Dennis vs Yarmouth Complete Performance Table
Dennis single-family homes sold in median 16 days compared to Yarmouth's 18 days—a minimal difference that reflects supply constraints rather than buyer preference intensity. With 35% fewer listings, Dennis properties move faster when correctly priced.
Yarmouth's larger inventory (317 vs 234 SF sales) creates slightly longer decision timelines as buyers evaluate more options. This isn't market weakness; it's selection abundance that benefits patient buyers seeking optimal value.
The condo markets showed reversed patterns: Yarmouth condos sold in 27 days versus Dennis's 30 days, reflecting higher quality and better amenities in Yarmouth developments.
Understanding where Dennis and Yarmouth dominate within Cape Cod's broader market dynamics gives you the strategic advantage for smart 2026 decisions. As luxury towns like Brewster faced -3.1% single-family corrections and Harwich saw dramatic village spreads with some areas declining significantly, both Dennis and Yarmouth delivered positive performance that separated them from struggling markets.
| Town | 2025 Performance | Median Price | Market Position |
|---|---|---|---|
| Yarmouth | +2.3% combined | $622,000 SF | VALUE LEADER |
| Dennis | +3.2% combined | $715,000 SF | PREMIUM STABLE |
| Brewster | -3.1% SF only | $850,000 SF | CORRECTING |
| Harwich | -4.0% combined | $750,000 SF | COOLING |
| Barnstable | +5.9% combined | $899,000 SF | STRONG |
Source: Deborah Camuso Cape Cod market analysis, February 2026
Yarmouth's +2.3% appreciation positions it as Cape Cod's value leader—positive growth at family-accessible pricing that crushed most luxury markets struggling with buyer resistance. Dennis's +3.2% appreciation with premium pricing demonstrates buyer conviction for quality village positioning even during broader market cooling.
The critical insight: while luxury markets faced corrections and volume declined across Cape Cod, both Dennis and Yarmouth maintained buyer engagement through different winning strategies. Yarmouth dominated through affordability and selection; Dennis sustained premiums through scarcity and lightning-fast transactions.
This Mid-Cape positioning advantage extends beyond 2025 performance. Both towns offer established infrastructure, proven buyer pools, and village variety that insulates them from the luxury market volatility affecting outer Cape properties.
Your Dennis versus Yarmouth decision starts with honest assessment of budget, timeline, and family priorities. Yarmouth provides superior value and selection; Dennis offers speed and prestige at premium pricing.
Perfect For: Families with $600-750K budgets, first-time Cape buyers, buyers prioritizing selection Key Advantages:
Yarmouth delivered 104 single-family sales in the $600-800K family target range compared to Dennis's 63 sales. For families who know their budget, Yarmouth provides significantly better selection and negotiating position.
The village analysis supports Yarmouth for value-conscious families: South Yarmouth alone delivered 146 single-family sales (more than many entire towns), while West Yarmouth provided 107 sales at consistent pricing below $750K.
Strategy: Focus on South Yarmouth and West Yarmouth for optimal family value, consider Yarmouth Port for moderate luxury at prices still below Dennis's premium villages.
Perfect For: Families with $700K+ budgets, buyers prioritizing speed, families seeking Mid-Cape luxury Key Advantages:
Dennis justifies higher pricing through superior market velocity and village prestige. Dennis village provides Mid-Cape luxury positioning comparable to Chatham suburbs, while Dennis Port offers family value at $618,640 median.
For families prioritizing condo affordability, Dennis delivers significant advantages with $290,000 median pricing versus Yarmouth's $416,500 median. Dennis Port's 44 condo sales averaging $291,820 create Cape Cod entry opportunities unavailable in Yarmouth.
Strategy: Target Dennis Port for family value or Dennis village for luxury positioning. Avoid East Dennis unless you specifically want moderate luxury at premium pricing.
Your selling strategy should weaponize your town's competitive advantages while positioning you for maximum market impact. Both Dennis and Yarmouth offer distinct seller advantages—the key is executing the right strategy based on your property's positioning.
Position properties as exceptional value within Cape Cod's most active Mid-Cape market. With 317 single-family sales versus Dennis's 234, emphasize buyer depth and market liquidity that creates competitive bidding when correctly priced.
Winning pricing strategy: Use village-specific recent sales rather than town-wide averages that miss opportunities. South Yarmouth properties should target $650-750K range emphasizing family amenities and highest transaction volume, while Yarmouth Port can command $800-950K positioning as accessible luxury with established buyer pools.
Market advantage messaging: "Yarmouth's proven buyer depth with 37% more market activity" creates urgency without discount positioning. Emphasize consistent village performance rather than competing on price alone.
For homeowners considering selling in the next 12-24 months: This same market analysis doubles as your pricing strategy foundation—you get strategic positioning intelligence now and expert guidance when you're ready to maximize value.
Price properties to reflect village-specific premiums while emphasizing speed advantages and appreciation performance. Dennis's +3.2% appreciation and 16-day median absorption justify premium positioning for correctly positioned properties.
Winning pricing strategy: Research village-specific comps rather than town averages. Dennis village properties should price at $1.2M+ reflecting luxury expectations and buyer willingness to pay premiums, while Dennis Port should target $550-650K capturing family buyers seeking Dennis positioning at accessible pricing.
Market advantage messaging: Emphasize "Dennis premium village positioning with 16-day median sales velocity" rather than generic speed claims. Buyers paying Dennis premiums expect rapid decisions and exclusive positioning.
Ready to position YOUR property for maximum value using these exact market advantages? Free Strategic Seller Analysis shows you optimal pricing, timing, and positioning strategy based on current inventory and buyer patterns. Call 508-335-3875 for your competitive edge.
Ready to navigate Dennis vs Yarmouth with complete market intelligence? Call me at 508-335-3875 or email [email protected] for personalized analysis of current inventory in both towns matching your family's needs.
Looking ahead to 2026, expect both markets to maintain their fundamental characteristics with Yarmouth continuing volume dominance and Dennis sustaining premium village positioning.
Yarmouth's 37% market activity advantage reflects structural factors that should persist: superior affordability, extensive village inventory, and consistent buyer appeal across price ranges. The 417 total sales in 2025 demonstrate buyer depth that supports continued transaction volume.
Dennis's premium positioning and village-specific luxury create differentiated inventory that attracts specific buyer demographics. The 16-day median absorption and +3.2% appreciation demonstrate buyer conviction that should continue supporting premium pricing.
Interest rate impact: If mortgage rates decline to 6-6.5% from current 7%+ levels, expect enhanced family buyer activity particularly benefiting Yarmouth's $600-750K inventory. Dennis may see increased luxury activity as financing costs decline for high-end buyers.
Inventory projections: Yarmouth's volume advantage should continue given established neighborhood inventory and consistent seller activity. Dennis's limited luxury village inventory creates natural supply constraints supporting continued premiums.
Q: Why does Yarmouth have 37% more sales than Dennis?
A: Yarmouth delivers superior affordability ($622K vs $715K median SF pricing), more family-suitable inventory (160 vs 79 properties), and three villages with consistent pricing under $750K. This creates broader buyer appeal and more transaction activity across all price ranges.
Q: Is Dennis's higher pricing worth it for families?
A: Dennis justifies premium pricing through faster sales velocity (16 vs 18 days), superior appreciation performance (+3.2% vs +2.3%), and access to luxury villages like Dennis village. Families prioritizing speed and prestige benefit; value-conscious families prefer Yarmouth's selection.
Q: Which town offers better family inventory in the $600-800K range?
A: Yarmouth delivered 104 single-family sales in this range versus Dennis's 63 sales—65% more family-target inventory. Both towns provide similar median pricing within this range ($675K Dennis, $685K Yarmouth), but Yarmouth offers significantly more selection.
Q: Should families consider condos in either town?
A: Dennis provides superior condo affordability ($290K vs $416K median) creating Cape Cod entry opportunities. Yarmouth offers higher-quality developments and amenities justifying premium pricing. Choose Dennis for affordability, Yarmouth for condo luxury.
Q: Which villages provide the best family value?
A: In Yarmouth: South Yarmouth (146 sales, $748K average) and West Yarmouth (107 sales, $722K average). In Dennis: Dennis Port (60 sales, $619K average) and South Dennis (65 sales, $729K average). These villages provide family amenities without luxury premiums.
The Dennis versus Yarmouth decision comes down to your family's priorities: Yarmouth provides superior value, selection, and market activity, while Dennis offers premium positioning, faster transactions, and village luxury options.
Here's what you get when you work with me to navigate this choice:
Complete Volume Analysis: I track every sale in both towns (721 total transactions analyzed), breaking down performance by village and price range rather than relying on incomplete data that misses market dynamics.
Strategic Market Positioning: Whether you're targeting Yarmouth's value advantage or Dennis's premium positioning, I position you based on actual transaction patterns and current inventory rather than generic advice.
Village-Level Expertise: 25+ years analyzing Cape Cod sales means I know which Yarmouth villages deliver the best family value and which Dennis villages justify premium pricing based on actual market results.
Family-Focused Analysis: I specialize in the $600-800K family buyer segment, understanding exactly which properties deliver the best value and which villages provide optimal family amenities in both towns.
If you're ready to choose your Mid-Cape town based on the same analysis that revealed Yarmouth's 37% market dominance and Dennis's premium positioning advantages, let's talk. Call me at 508-335-3875, email [email protected], or visit debcamuso.com.
I'm here to help you find the right town, right village, and right property based on data-driven analysis rather than assumptions—whether that means Yarmouth's superior value and selection or Dennis's premium positioning and market velocity.
ABOUT DEBORAH CAMUSO
I've analyzed over 25 years of Cape Cod real estate transactions, and I've never seen such clear market dynamics as the Dennis vs Yarmouth comparison reveals. With direct MLS access to all Mid-Cape sales data, I track every transaction to understand not just town-wide performance but village-level patterns that determine actual buyer outcomes. Yarmouth's 37% volume advantage and Dennis's premium positioning create distinct opportunities for different family types. Whether you're targeting maximum value and selection or premium speed and prestige, I help families make data-driven decisions based on actual market intelligence rather than generic advice that misses the real dynamics driving these two very different Mid-Cape markets.
Let's talk: [email protected] | 508-335-3875 | debcamuso.com
Analysis based on complete 2025 MLS closed sales data for Dennis (304 transactions) and Yarmouth (417 transactions), representing all single-family and condominium sales January 1 through December 31, 2025. Market metrics, pricing analysis, and village breakdowns derived from actual transaction records. This analysis completed February 2026 reflecting market conditions as of that date.


Deborah would love an opportunity to talk with you and show you why it would be a benefit to work with her. In a world full of uncertainty, she will guide you in the correct direction and ensure that you make the most confident decisions. Connect with Deborah - She is here to offer insight and support whenever you are ready.
Work With Deborah