Cape Cod Q1 2026: Which Towns Still Crushed It Through a Brutal Winter—and Where Opportunity Just Opened Up
After analyzing 562 Q1 2026 closed sales versus 626 Q1 2025 sales across all Cape Cod towns, the winter story reveals two distinct opportunities: towns that crushed it despite unprecedented New England blizzards, and markets where brutal weather conditions created unexpected buyer advantages. Complete single-family and condominium analysis of 1,597 total Q1 2026 market activities (562 closed, 400 pending, 621 active) shows which markets rewarded persistence and where smart money finds opportunity in temporarily softened competition.
QUICK DATA: Cape Cod Q1 2026 Winter Market Analysis
Winter Impact Assessment:
Winners vs Opportunity Markets Comparison:
| Category | Top Performer | Q1 2025 Sales | Q1 2026 Sales | Change | Property Mix (2026) | Opportunity Insight |
|---|---|---|---|---|---|---|
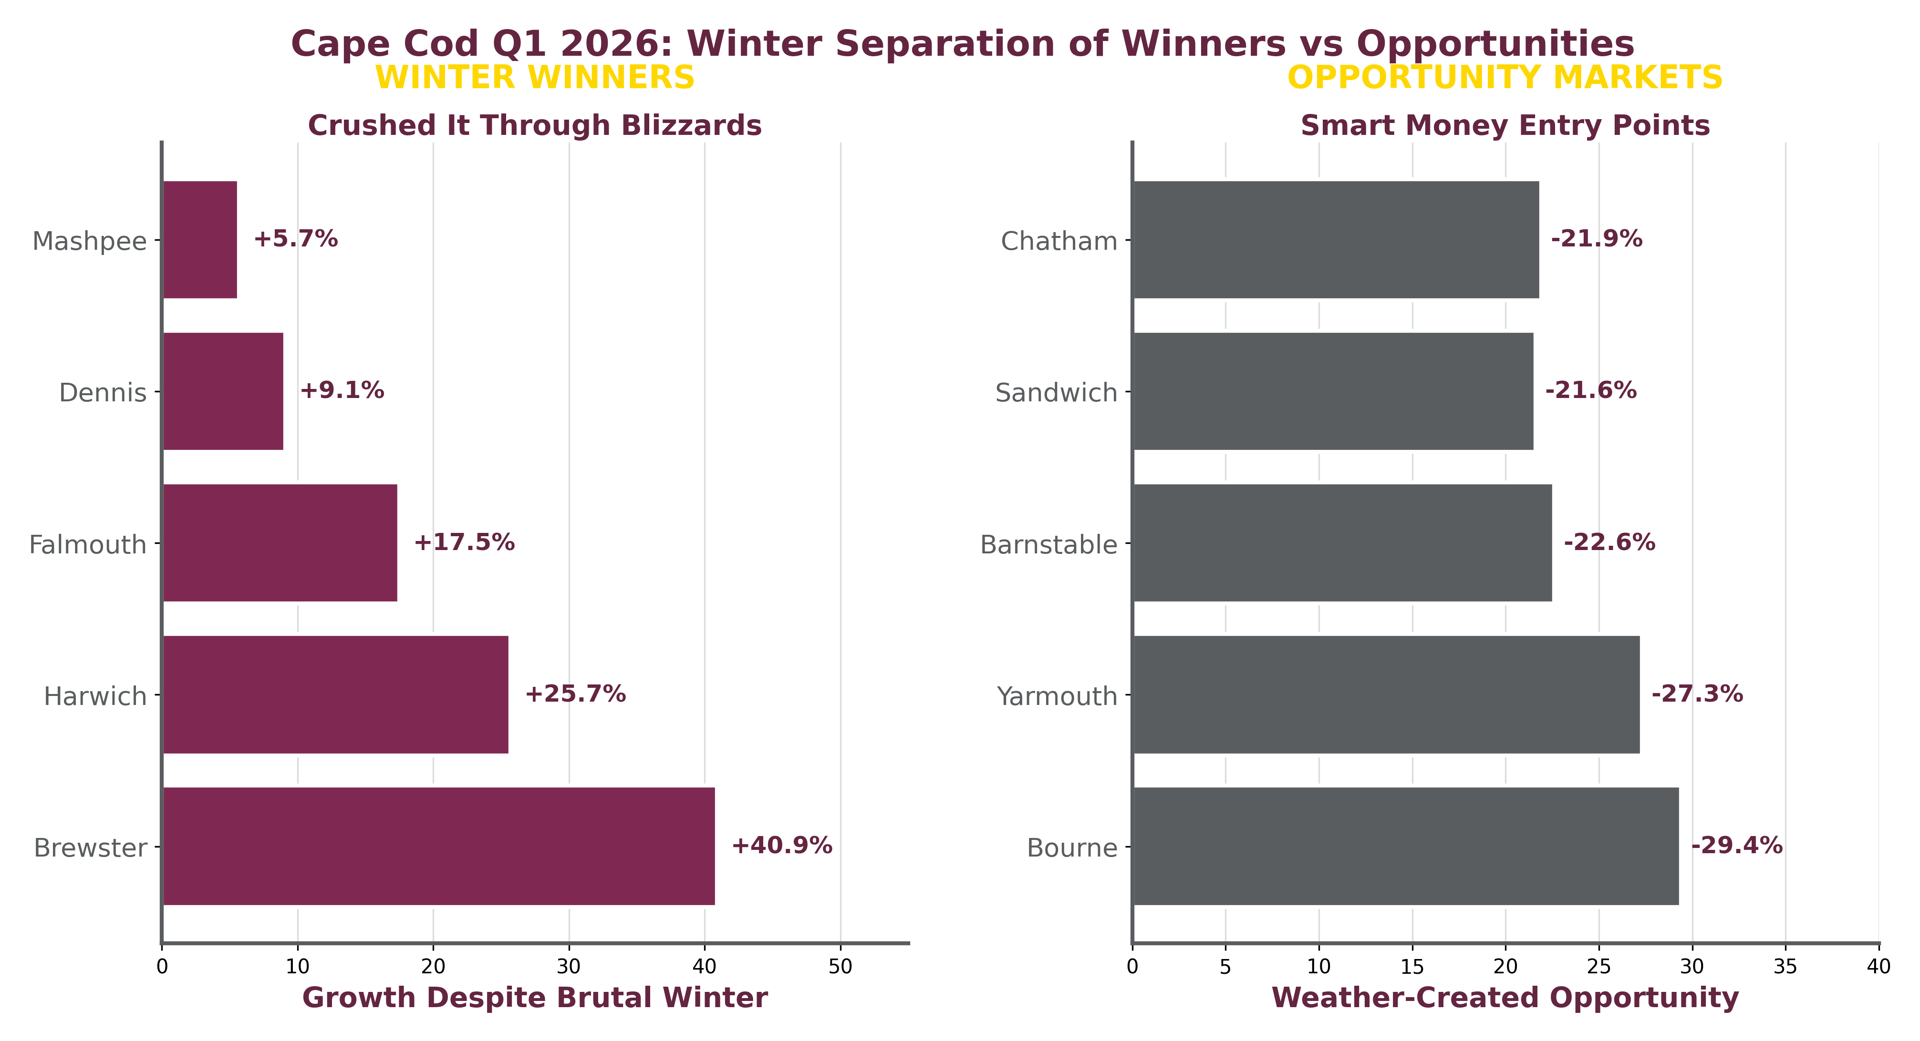
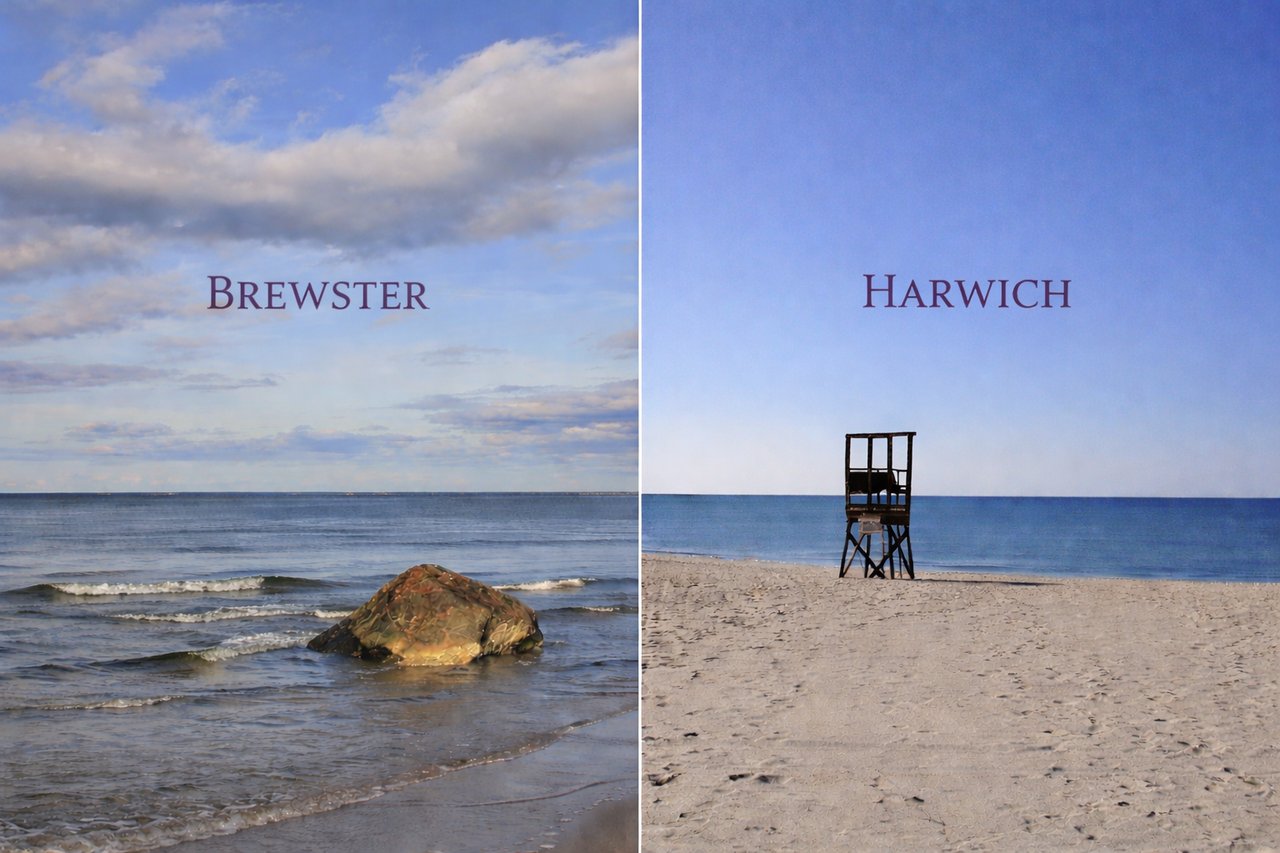
| WINTER WINNER | Brewster | 22 (14 SF, 8 CN) | 31 (18 SF, 13 CN) | +40.9% | SF + CN Growth | Crushed it despite weather |
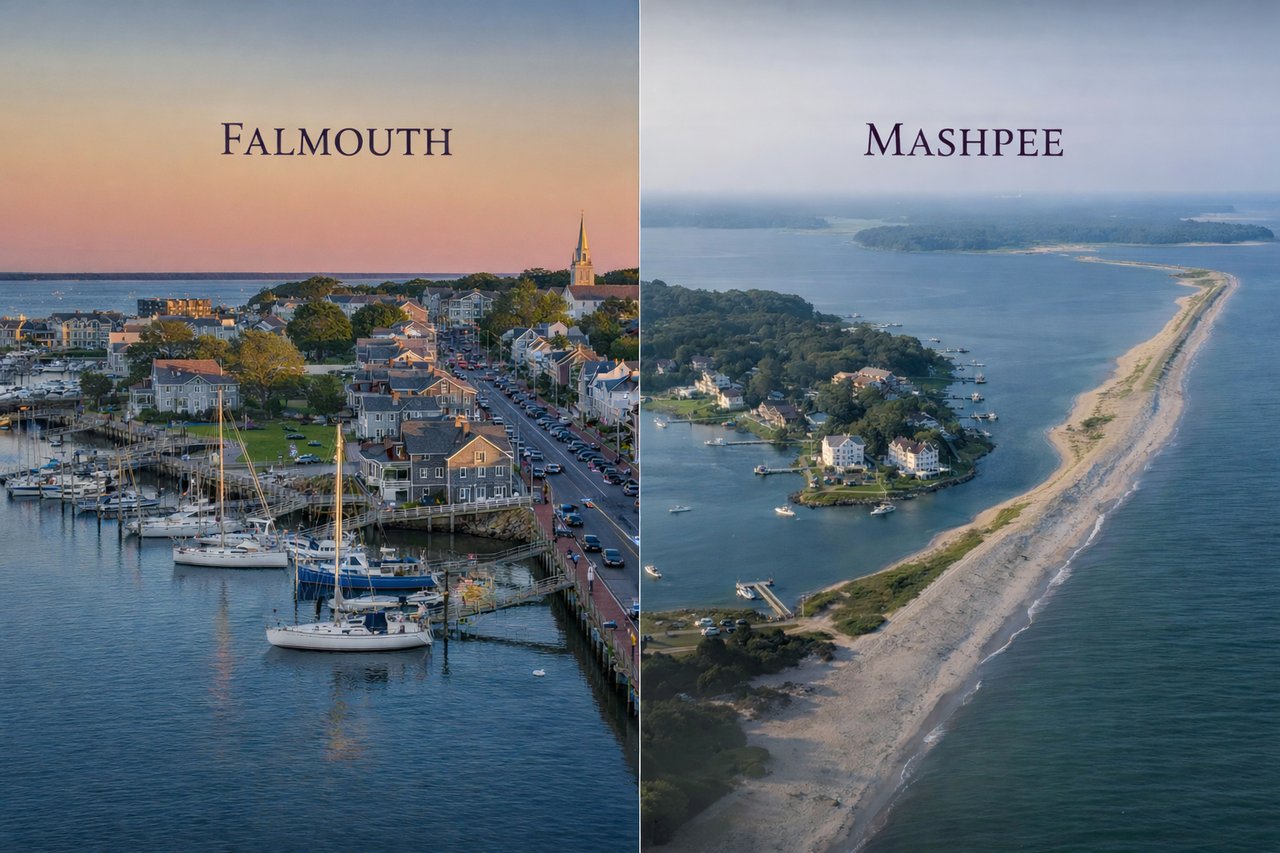
| VOLUME WINNER | Falmouth | 63 (51 SF, 12 CN) | 74 (67 SF, 7 CN) | +17.5% | SF Strength | Leading through adversity |
| MOMENTUM WINNER | Harwich | 35 (33 SF, 2 CN) | 44 (37 SF, 7 CN) | +25.7% | Strong SF Growth | Lower Cape surge |
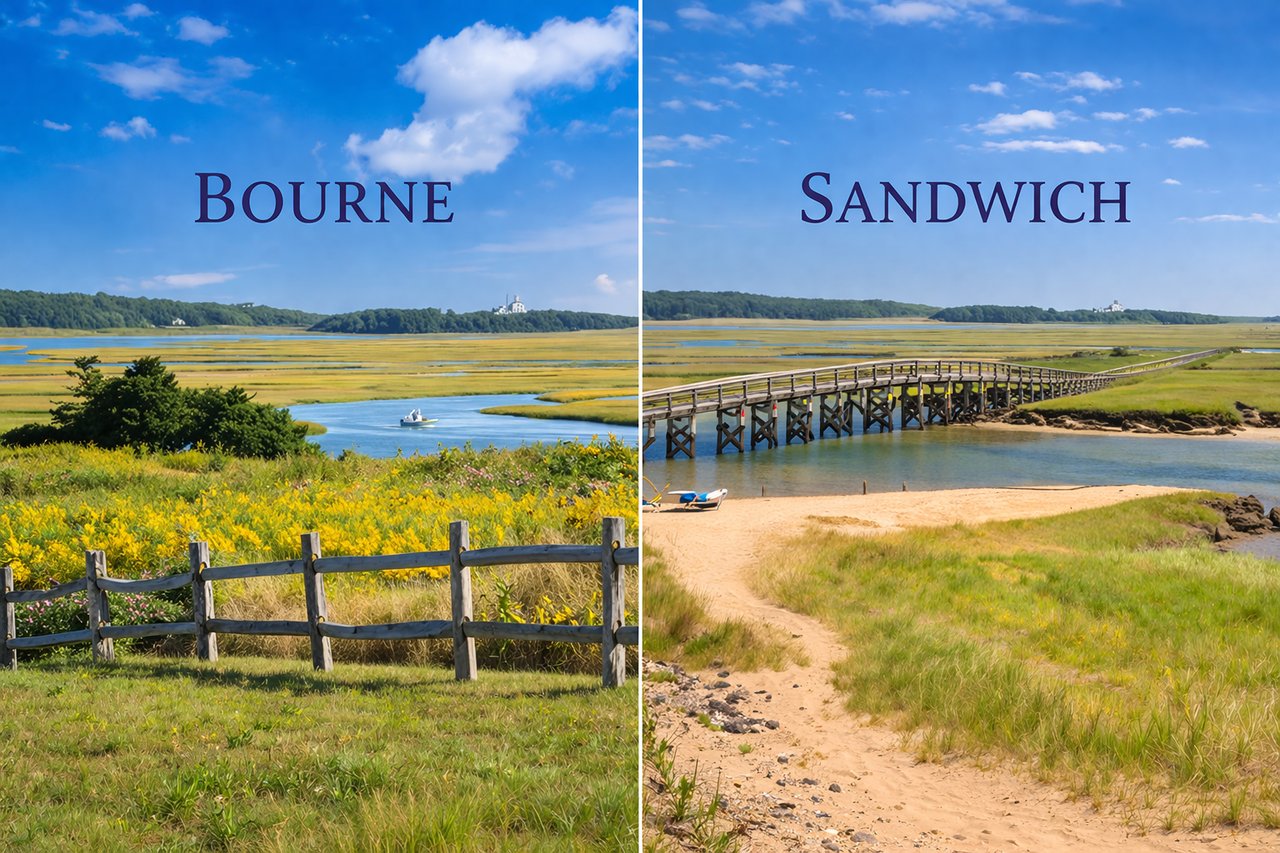
| OPPORTUNITY MARKET | Bourne | 34 (26 SF, 8 CN) | 24 (20 SF, 4 CN) | -29.4% | SF + CN Softening | Smart money entry point |
| VOLUME OPPORTUNITY | Yarmouth | 77 (54 SF, 23 CN) | 56 (41 SF, 15 CN) | -27.3% | Broad Pullback | Temporary buyer advantage |
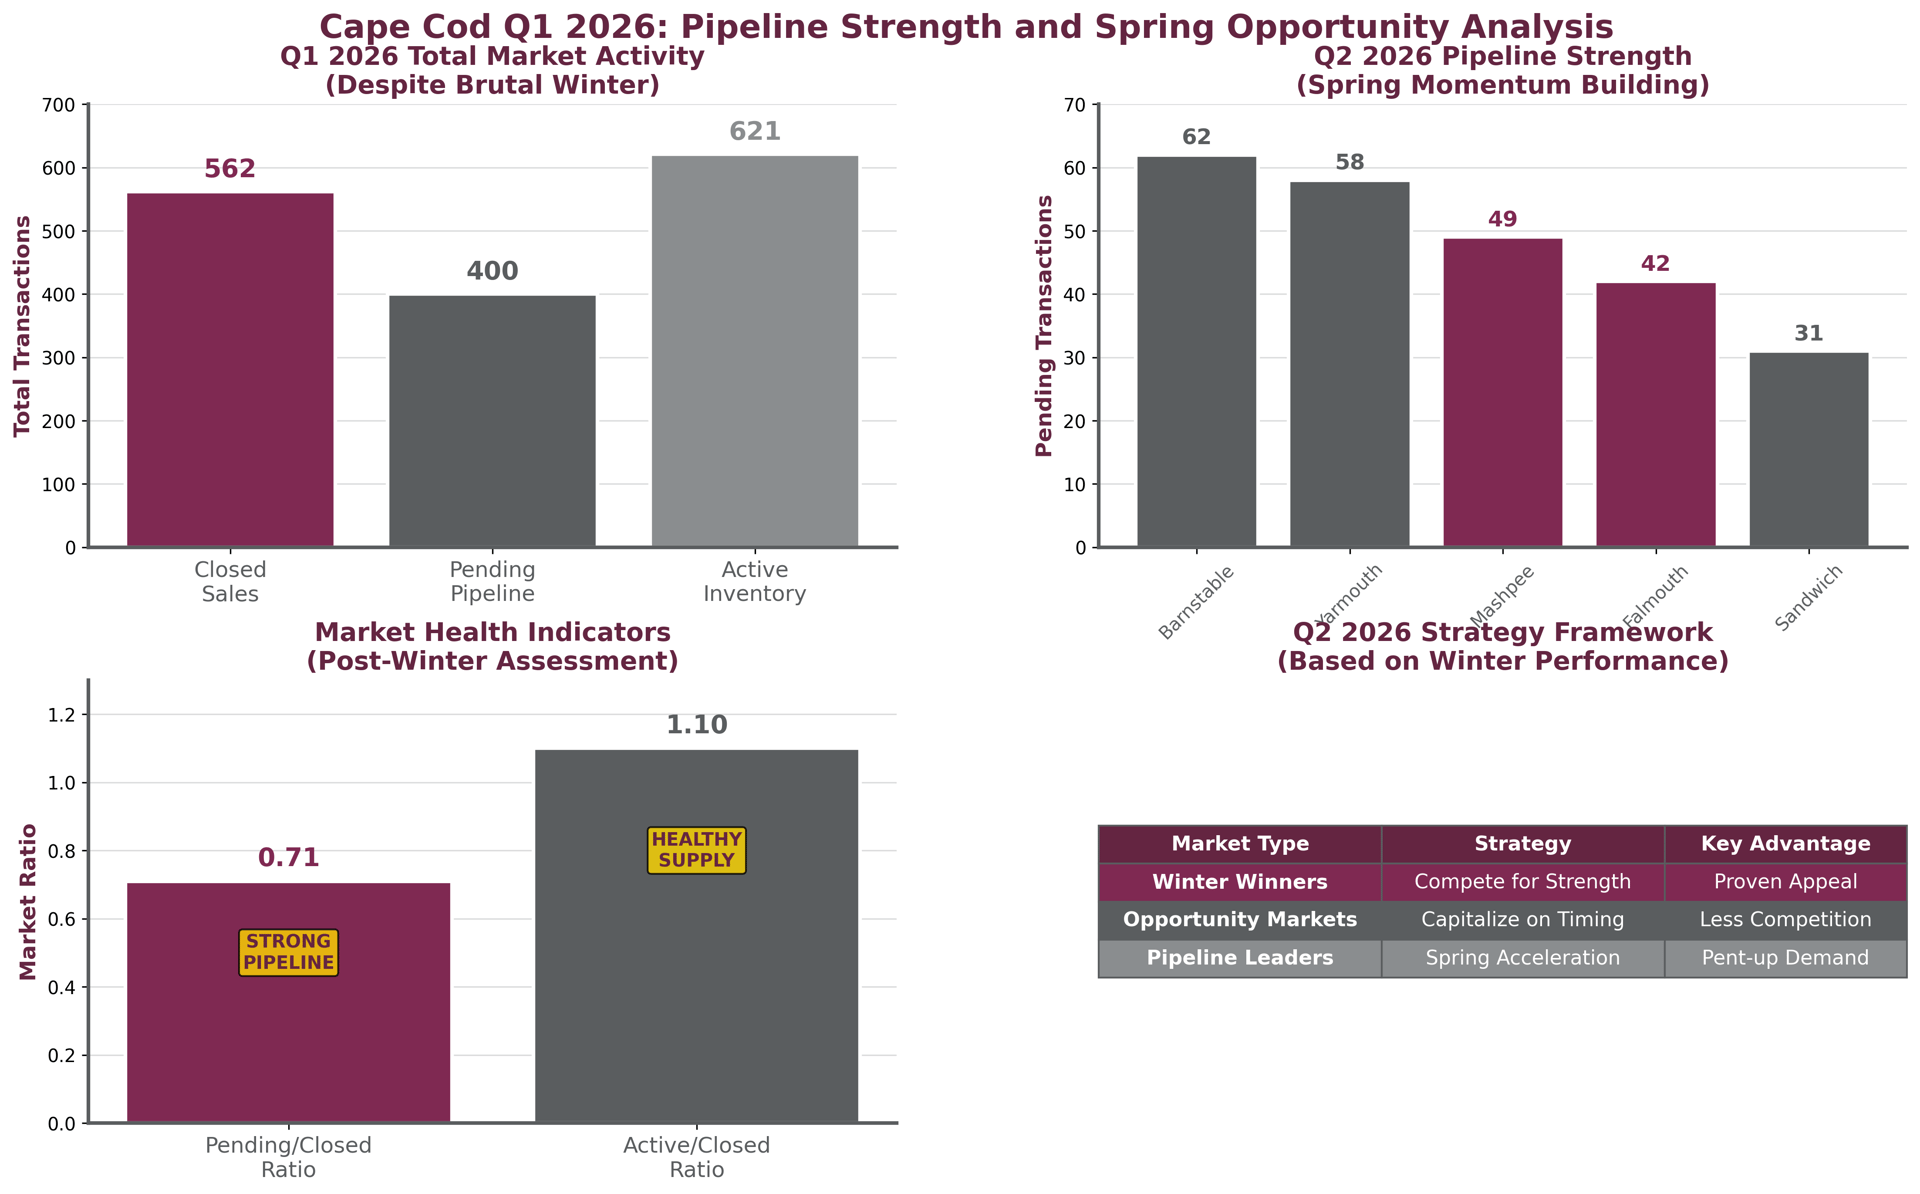
Q2 2026 Pipeline Strength: 400 pending transactions indicate market momentum building post-winter
Here's what actually happened in Q1 2026: New England got hit with winter weather unlike anything we've seen in years. I'm talking blizzards that shut down showings for weeks, ice storms that kept sellers from listing, and conditions that would normally crater any real estate market. But here's the fascinating part—some Cape towns didn't just survive this brutal winter, they absolutely crushed it.
Brewster somehow managed to surge 40.9% despite the weather chaos. Harwich powered through with a 25.7% jump. Falmouth, already a volume leader, managed to grow another 17.5% even when half the Cape was snowed in. Meanwhile, other markets that typically perform well—like Bourne, Yarmouth, and Barnstable—saw temporary softening that's creating real opportunities for smart buyers.
After 25 years of Cape Cod real estate, I've learned that winter markets reveal the truth about towns. When conditions get tough, strong markets push through while others pause. Some markets had buyers determined to purchase and sellers confident enough to list despite blizzards. Others saw smart sellers wait for spring while creating opportunities for strategic buyers.
The numbers from 1,597 total Q1 2026 market activities tell this story clearly: 562 sales closed despite the weather, 400 more are pending (meaning Q2 should rebound nicely), and 621 active listings are ready for spring buyers who couldn't get out during the storms. This winter separated the momentum markets from the opportunity markets, and both categories offer different advantages for 2026 strategies.
Ready to understand which Cape markets proved their strength and where the smart money is finding opportunity? Let's dig into what winter actually taught us about where to focus your 2026 search.
Cape Cod Q1 2026 Winter Winners vs Opportunity Markets Analysis
These are the Cape markets that looked at record blizzards and said "hold my beer." When showing conditions were brutal and most markets would pause, these towns kept moving properties. That tells you something important about buyer demand and market strength.
Q1 Performance: 22→31 sales (+40.9%)
Property Mix: Q1 2025: 14 SF, 8 CN → Q1 2026: 18 SF, 13 CN
Brewster's winter performance was nothing short of remarkable. While other towns were digging out from storms, Brewster buyers and sellers somehow found ways to close 31 deals versus last year's 22. The growth came from both single-family (14→18 sales) and condo (8→13 sales) markets, showing broad-based winter strength that weather couldn't stop.
What's driving Brewster's strength? The town sits at that sweet spot where you get Lower Cape charm without Chatham's luxury pricing. When buyers are determined enough to house-hunt through blizzards, they're serious buyers with serious budgets. When sellers are confident enough to stay on the market during storms, they're in markets with real demand. Brewster gave both sides what they wanted.
Q1 Performance: 35→44 sales (+25.7%)
Property Mix: Q1 2025: 33 SF, 2 CN → Q1 2026: 37 SF, 7 CN
Harwich proved that Lower Cape momentum isn't limited to one town. The jump from 35 to 44 sales during one of the worst winters in memory shows this market has underlying strength that weather doesn't derail. Notably, most growth came from single-family (33→37 sales) with significant condo growth (2→7 sales) showing broader market appeal.
When I work with Harwich buyers and sellers, they're typically choosing the area specifically—not just shopping around. The village-level story in Harwich is particularly interesting, with Harwich Port continuing to attract both buyers who want water access and sellers confident in village charm, while main Harwich areas offer value positioning that keeps both sides engaged.
Q1 Performance: 63→74 sales (+17.5%)
Falmouth entering winter as a volume leader and coming out even stronger tells you everything about this market's foundation. Moving from 63 to 74 sales isn't just growth—it's growth during the worst possible conditions. That's what happens when a market has both buyer demand and inventory depth.
The East Falmouth village numbers are particularly strong, with 26 Q1 sales helping drive overall performance. Falmouth benefits from being large enough to offer variety (different villages, different price points) while still maintaining that Upper Cape accessibility and charm. When weather gets brutal, markets with options and momentum keep performing.
Dennis: 44→48 sales (+9.1%)
Mashpee: 53→56 sales (+5.7%)
Both Dennis and Mashpee showed steady winter strength without the explosive growth of the other winners. Dennis's progression to 48 sales and Mashpee's 56 sales (leading all villages) represent solid, sustainable performance that suggests underlying market health.
These markets didn't need to surge 40% to prove their worth. Sometimes steady growth through tough conditions is more impressive than dramatic swings, because it suggests real buyer demand rather than temporary momentum.
The Winner Strategy:
If you're considering these winter-strong markets, understand that you're competing with buyers who were determined enough to house-hunt through blizzards. These markets proved their appeal when conditions were awful, so don't expect spring to make them easier or cheaper.
Perfect for: Buyers who want proven market strength, people willing to compete for quality properties, confidence in market momentum over weather concerns.
Here's where the winter story gets interesting for smart buyers. Some typically strong Cape markets saw temporary pullbacks that had nothing to do with long-term value and everything to do with weather timing. That creates opportunities for buyers who understand the difference between weather delays and market weakness.
Q1 Performance: 34→24 sales (-29.4%)
Property Mix: Q1 2025: 26 SF, 8 CN → Q1 2026: 20 SF, 4 CN
Bourne's Q1 numbers look rough until you consider the context. This is a market that normally performs well, caught in the perfect storm of brutal winter weather and Upper Cape timing challenges. The decline affected both single-family (26→20 sales) and condo (8→4 sales) markets, reflecting weather delays rather than disappearing demand—and that creates opportunity for both buyers and sellers.
What makes this particularly interesting: Bourne typically offers some of the best value positioning on the Cape, and temporary winter softening could enhance that advantage for buyers, while creating less competition for sellers when spring activity picks up. When normal showing patterns resume, buyers who positioned during quiet periods often benefit, while sellers who delayed listings can capture pent-up demand.
Q1 Performance: 77→56 sales (-27.3%)
Yarmouth's winter pullback is particularly notable because this market typically maintains steady volume across seasons. The decline from 77 to 56 sales suggests weather significantly impacted both listing and showing activity—classic temporary market disruption rather than fundamental demand shifts.
For buyers who understand Yarmouth's market, this represents a timing advantage. The villages of Yarmouth Port and West Yarmouth each showed different winter responses, creating specific opportunities within the broader market pause. When a typically active market goes quiet due to weather, prepared buyers often find better selection and negotiating positions.
Q1 Performance: 115→89 sales (-22.6%)
Barnstable's winter performance deserves context: this remains the Cape's volume leader even with the Q1 decline. Moving from 115 to 89 sales during brutal conditions still represents massive market activity. The pullback creates opportunity without suggesting fundamental market problems.
The village-level data shows Hyannis, Centerville, and Marstons Mills all contributing to overall activity, though at reduced winter levels. For buyers, this means more inventory choice and potentially less competition in a market that typically moves quickly due to volume and variety.
Sandwich: 51→40 sales (-21.6%)
Chatham: 32→25 sales (-21.9%)
Both markets showed similar winter impact patterns, suggesting weather affected Upper and Lower Cape luxury segments similarly. These declines likely reflect showing difficulties and seller timing decisions rather than demand disappearance.
The Opportunity Strategy:
These markets aren't "failing"—they're experiencing temporary weather-related pauses that create timing advantages for prepared buyers. When normal spring activity resumes, buyers who positioned themselves during the quiet period often benefit significantly.
Perfect for: Strategic value buyers, people who prefer less competition, buyers with flexible timing, smart money looking for temporary market advantages.
Cape Cod Q1 2026 Pipeline and Opportunity Analysis
Here's the data point that should give everyone confidence about Cape Cod's spring market: despite brutal winter conditions, we closed Q1 2026 with 400 pending transactions in the pipeline. That's not the number you see in a market that's fundamentally struggling—that's the number you see when weather delayed activity that's now ready to convert.
The pending-to-closed ratio of 0.71 (400 pending vs 562 closed) suggests healthy underlying demand that winter weather temporarily suppressed rather than eliminated. When I see strong pipeline numbers after difficult market conditions, it usually means spring activity will be robust as delayed transactions move forward.
Town-by-Town Pipeline Strength: The pending distribution tells an interesting story about where Q2 momentum is building. Barnstable leads with 62 pending, followed by Yarmouth with 58—both markets that saw winter declines but clearly have buyer demand waiting for better conditions. Mashpee's 49 pending transactions suggest continued strength building on its Q1 performance.
Even the opportunity markets show pipeline activity: Sandwich has 31 pending and Orleans shows 22, indicating that temporary winter softening doesn't mean absence of buyer interest. When spring showing conditions normalize, these pending transactions should convert to closed sales.
The Inventory Picture: With 621 active listings across the Cape, inventory levels look healthy for spring buyers without being overwhelming. The active-to-closed ratio of 1.10 suggests reasonable supply that should support continued market activity without creating pricing pressure in either direction.
This inventory distribution also varies by town, creating different spring market dynamics. Barnstable leads active inventory with 102 listings, while Provincetown shows 60—reflecting both seasonal patterns and weather-delayed listing activity that should normalize as conditions improve.
While town-wide numbers tell the big story, village-level performance reveals where the most interesting opportunities exist within each market. Winter conditions affected different villages differently, creating micro-markets within the broader town performance patterns.
Q1 2026 Top Villages by Volume:
The village data reveals something important: even within opportunity markets, specific villages maintained strength. Sandwich village performed well despite overall town softening. East Falmouth contributed significantly to Falmouth's overall winter success.
For buyers, this village-level granularity matters because it identifies specific areas where opportunity or momentum exists within broader market trends. You might find value in a Bourne village while avoiding softer areas, or compete for properties in high-performing villages within winning towns.
Your Q2 2026 Cape Cod strategy should align with whether you want to compete in proven winter-strong markets or capitalize on temporary opportunities created by weather-delayed activity. Both approaches offer advantages depending on your priorities and timing flexibility.
Choose This Strategy If: You want markets that proved their appeal under worst-case conditions, don't mind competition for quality properties, prefer confidence over bargains.
Target Markets: Brewster, Harwich, Falmouth, Dennis, Mashpee
Strategy: Move quickly when spring activity accelerates, prepare for competition, focus on specific villages within winning towns, understand you're paying for demonstrated market strength.
Timing Advantage: These markets proved they can perform under adverse conditions, so spring normalization should enhance activity rather than create it. Properties that didn't come to market during winter may appear in spring, but buyer demand will be stronger too.
Choose This Strategy If: You understand the difference between weather delays and market weakness, prefer less competition and better negotiating positions, have timing flexibility.
Target Markets: Bourne, Yarmouth, Barnstable, Sandwich, Chatham
Strategy: Position during spring transition period, research village-level opportunities within broader market pauses, prepare to move when conditions normalize.
Timing Advantage: These markets should see activity acceleration as weather improves and delayed transactions activate. Buyers who position early in this transition often benefit from reduced competition before normal market velocity returns.
Advanced Strategy: Target markets with strong pending pipelines that suggest Q2 acceleration potential.
Target Markets: Barnstable (62 pending), Yarmouth (58 pending), Mashpee (49 pending)
Strategy: Understand that pending activity often indicates motivated sellers and serious buyers who will convert to closed sales, creating market momentum.
Ready to determine which strategy fits your Cape Cod goals and timing? Free Market Strategy Analysis reveals specific village opportunities, pending pipeline insights, and positioning guidance based on your Q2 2026 timeline and market approach. Call 508-335-3875 for strategy conversation that focuses on market reality rather than weather excuses.
Your Cape Cod selling strategy should capitalize on either demonstrated winter strength or pent-up demand created by weather delays, depending on your market position and timing needs.
Position properties within markets that demonstrated buyer demand under worst-case conditions. These markets proved their appeal when showing was difficult, suggesting spring normalization will enhance rather than create buyer interest.
Winner Market Strategy: Price properties to reflect demonstrated market strength while emphasizing winter performance that proves buyer demand resilience. Buyers who want Brewster, Harwich, or Falmouth proved they'll pursue properties even during blizzards.
Competitive Advantage: Use winter performance data to justify pricing and market properties based on "winter-tested buyer demand" rather than hoping spring will create interest. These markets attracted persistent buyers during difficult conditions.
Position properties to benefit from weather-delayed activity that should accelerate as spring conditions normalize. These markets have underlying demand that winter temporarily suppressed rather than eliminated.
Opportunity Market Strategy: Time listings for spring acceleration while emphasizing temporary nature of winter softening and underlying market fundamentals. Buyers who delayed winter activity due to weather should return to normal shopping patterns.
Timing Benefits: Markets that paused due to weather often see robust spring activity as delayed transactions and new listings create renewed market momentum. Position to capture this acceleration rather than compete against it.
Use village-level performance data to position properties within the strongest areas of each town, regardless of overall town performance patterns.
Village Strategy: Even opportunity markets had strong-performing villages, and winter winners had varied village performance. Position properties based on specific village data rather than town-wide generalizations.
Ready to position YOUR property for maximum spring appeal using Q1 performance insights? Free Spring Market Strategy Analysis reveals optimal pricing, timing, and positioning approaches based on your specific market's winter performance and Q2 pipeline strength. Call 508-335-3875 for competitive market positioning advantage.
Looking ahead through 2026, expect Cape Cod markets to reflect the patterns established during Q1's brutal winter test: markets that proved their appeal under adverse conditions should continue strong performance, while opportunity markets should normalize as weather constraints disappear and delayed activity converts.
Winter Winners Outlook: Markets that surged despite brutal conditions (Brewster, Harwich, Falmouth) likely have underlying demand strength that will continue through 2026 as normal showing patterns resume and spring inventory increases. These markets passed the ultimate stress test.
Opportunity Markets Outlook: Markets that experienced weather-related pauses (Bourne, Yarmouth, Barnstable) should see activity normalization as spring conditions allow delayed transactions to convert and normal seasonal patterns resume. The 400 pending pipeline suggests this recovery is already beginning.
Pipeline Momentum: The strong Q1 pending numbers (400 transactions) indicate robust Q2 potential that should carry into summer seasonal strength. When markets maintain transaction pipelines despite brutal weather, it suggests fundamental demand health rather than weather-dependent activity.
Interest Rate Context: If mortgage rates decline from current levels, expect particular benefits for opportunity markets where temporary weather-related softening created buyer advantages. Both winner and opportunity markets should benefit from improved financing conditions.
Strategic Recommendations: Choose between winter-proven market strength (higher competition, demonstrated appeal) or opportunity market positioning (better timing, less competition) based on personal priorities rather than attempting to time broader market cycles that affect all Cape properties similarly.
Q: Should buyers worry about markets that declined during the brutal winter?
A: The winter context changes everything. Markets that declined 20-30% during record blizzards aren't "failing"—they're experiencing weather-delayed activity that creates timing opportunities for smart buyers. The 400 pending pipeline suggests demand didn't disappear, it got postponed.
Q: Why did some markets surge while others struggled during the same winter conditions?
A: Different towns have different seasonal patterns, buyer demographics, and showing logistics. Markets with strong momentum entering winter (like Brewster and Harwich) had buyer demand that pushed through weather obstacles. Others with more seasonal buyers naturally paused during brutal conditions.
Q: How do the village-level numbers change the town-wide story?
A: Village analysis reveals opportunities within broader market trends. Even opportunity markets had strong-performing villages, and winter winners showed varied village performance. Focus on specific villages rather than town-wide generalizations for actual property decisions.
Q: What does the 400 pending pipeline mean for Q2 2026 market activity?
A: Strong pending numbers after difficult market conditions typically indicate robust spring activity as delayed transactions convert. The pending-to-closed ratio of 0.71 suggests healthy underlying demand that should accelerate as normal showing conditions resume.
Q: Should sellers in opportunity markets wait for market recovery before listing?
A: Opportunity markets aren't "broken"—they're experiencing temporary weather-related pauses that create specific timing advantages. Smart positioning during spring transition periods often captures pent-up demand before full market velocity returns.
The Q1 2026 winter performance revealed two distinct Cape Cod opportunities: markets that crushed it despite brutal conditions (Brewster +40.9%, Harwich +25.7%, Falmouth +17.5%) and markets where weather delays created temporary buyer advantages (Bourne, Yarmouth, Barnstable).
Here's what you get when you work with me to navigate these post-winter opportunities:
Winter-Tested Market Intelligence: I analyze every Q1 transaction across all Cape markets (1,597 total activities), including winter performance patterns, pipeline strength, and village-level opportunities rather than weather excuses or generic seasonal predictions.
Strategy-Specific Market Positioning: Whether you're targeting winter-proven markets or capitalizing on opportunity timing, I position you based on actual performance data and spring pipeline analysis rather than assumptions about weather impact or market recovery.
Village-Level Opportunity Expertise: 25+ years analyzing Cape Cod markets means I understand which specific villages offered strength or opportunity within broader town trends, and how winter performance predicts spring positioning for maximum advantage.
Pipeline-Intelligence Advantage: Every recommendation backs up with pending transaction analysis, inventory assessment, and spring acceleration timing that reveals why some markets will rebound while others continue momentum through proven winter performance.
If you're ready to choose your Cape Cod strategy based on the same analysis that revealed winter winners versus opportunity markets and spring positioning advantages, let's talk. I'll help you understand whether to compete in proven markets or capitalize on temporary opportunities based on market reality rather than weather assumptions.
Call me at 508-335-3875, email [email protected], or visit debcamuso.com. I'm here to help you make the smartest decision based on what winter actually taught us about Cape Cod market strength—whether that means competing for winter-tested appeal or finding opportunity in temporarily quiet markets.
ABOUT DEBORAH CAMUSO
I've been a Cape Cod real estate broker for over 25 years. What sets me apart is my ability to read market conditions beyond the obvious—like understanding the difference between weather delays and actual market weakness. I help clients position for whatever advantage each situation offers, whether that means competing in hot markets or finding opportunity in temporarily quiet ones.
Let's talk: [email protected] | 508-335-3875 | debcamuso.com
Analysis based on complete Q1 2026 MLS activity including single-family and condominium data: 562 closed sales, 400 pending transactions, 621 active listings representing all Cape Cod town activity January 1 through March 31, 2026. Winter performance comparisons derived from Q1 2025 baseline of 626 closed sales with weather impact assessment and pipeline analysis for Q2 2026 outlook. Village-level insights reflect actual transaction locations within town boundaries. This analysis completed April 1, 2026 reflecting complete Cape Cod market conditions and spring positioning opportunities as of that date.


Deborah would love an opportunity to talk with you and show you why it would be a benefit to work with her. In a world full of uncertainty, she will guide you in the correct direction and ensure that you make the most confident decisions. Connect with Deborah - She is here to offer insight and support whenever you are ready.
Work With Deborah