Mashpee Real Estate 2025: Single-Family Homes Surged +11.3% While Condos Declined—And What It Means for 2026 Buyers
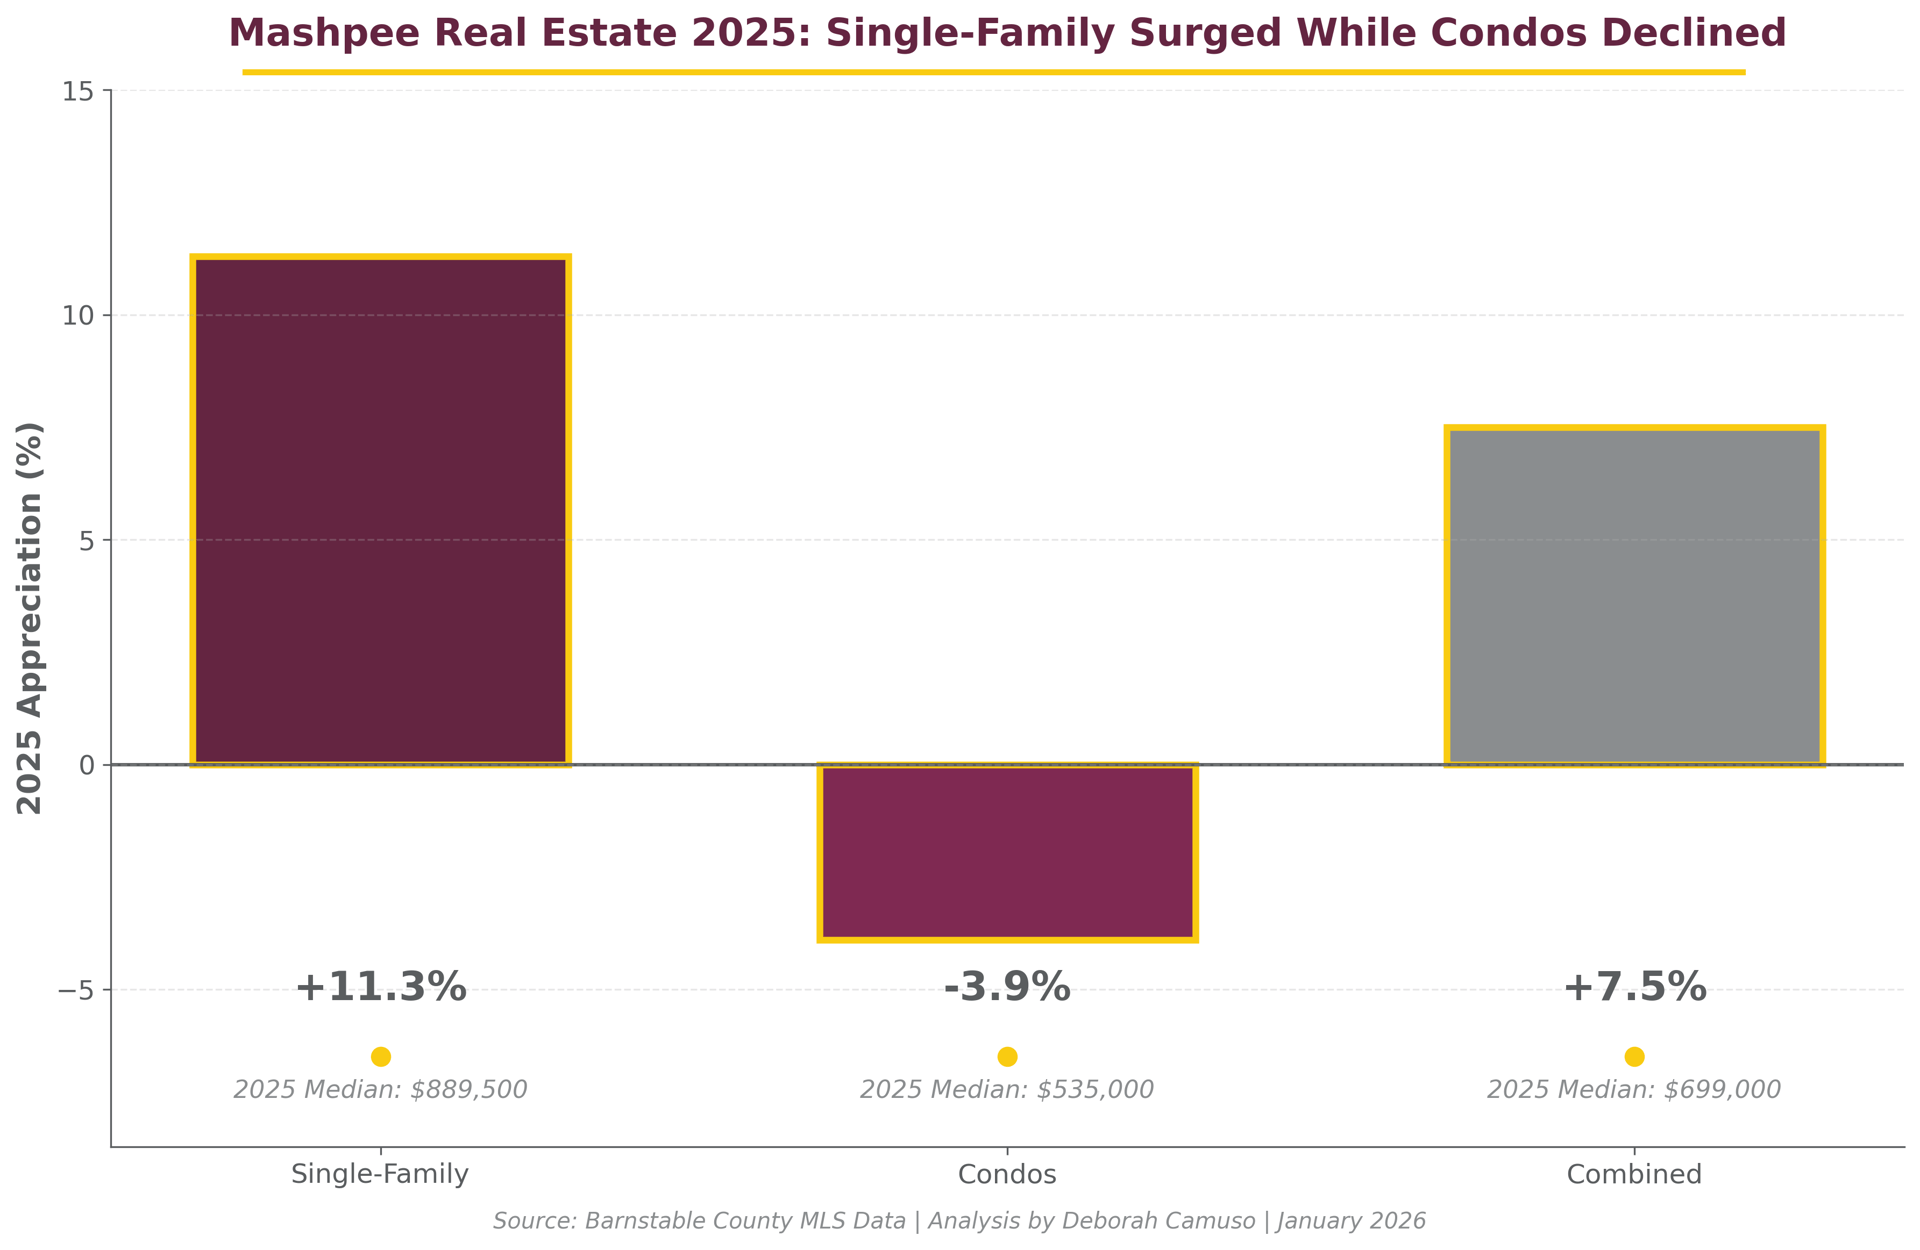
Analyzing single-family homes and condos separately, Mashpee single-family homes surged from $799,000 to $889,500 (+11.3%, $90,500 gain) while condos declined from $557,000 to $535,000 (-3.9%, $22,000 loss)—creating a 15.3-point performance spread that reveals two completely different markets operating in the same town.
Market Overview:
Property Type Performance:
|
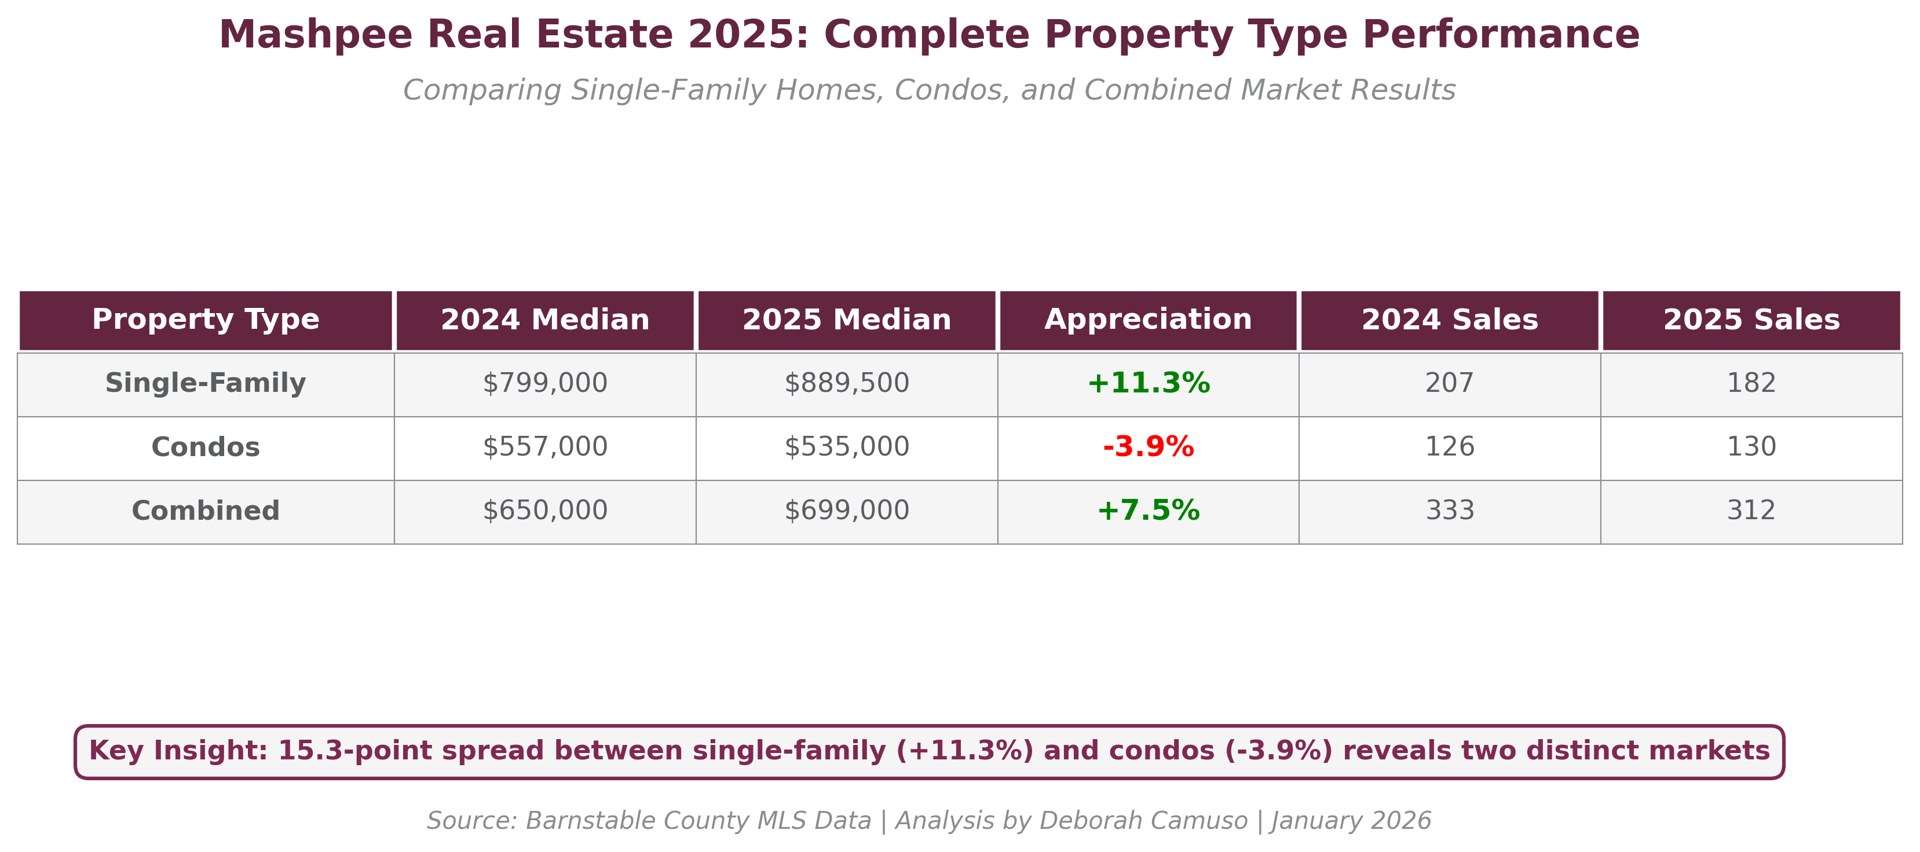
Property Type |
2024 Median |
2025 Median |
Appreciation |
Sales Volume |
|
Single-Family |
$799,000 |
$889,500 |
11.3% |
207 → 182 |
|
Condos |
$557,000 |
$535,000 |
-3.9% |
126 → 130 |
|
Combined |
$650,000 |
$699,000 |
7.5% |
333 → 312 |
Key Insight: Combined +7.5% appreciation masks dramatic divergence—single-family homes appreciated strongly while condos corrected
Note: Mashpee has no village-level MLS breakdown; analysis by property type instead
Source: MLS analysis by Deborah Camuso, January 12, 2026
If you bought a single-family home in Mashpee in 2024, you gained $90,500 in one year. If you bought a condo, you lost $22,000. Same town, same year, but property type determined whether you won or lost—and 2026 buyers and sellers need to understand why these markets moved in opposite directions.
As of January 12, 2026, Deborah Camuso analyzed every closed sale in Mashpee—separating single-family homes from condos—across January through December in both 2024 and 2025. Since Mashpee lacks village-level MLS data (unlike towns where the Camuso Village-Level Analysis methodology segments by village), this property type comparison reveals the real story behind Mashpee's 2025 market and where opportunities exist heading into 2026.
Overall, Mashpee saw 312 sales in 2025 combining single-family homes and condos, down 6.3% from 333 in 2024—modest volume decline that signals buyers becoming slightly more selective. Single-family homes specifically showed 182 sales versus 207 in 2024 (down 12.1%), while condo sales increased from 126 to 130 (+3.2%). This volume shift—fewer single-family transactions but more condo activity—combined with opposite price movements creates the complete picture: single-family buyers competed aggressively for limited premium inventory, driving prices up 11.3%, while condo buyers found more choices and negotiated prices down 3.9%. Understanding which property type you're buying or selling determines your entire 2026 strategy.
Mashpee Property Type Appreciation Bar Chart
SINGLE-FAMILY HOMES: THE SURGE STORY
Single-Family Performance: +11.3% Appreciation
Here's what happened with Mashpee single-family homes in 2025: properties that sold for $799,000 in 2024 were commanding $889,500 in 2025. That's a $90,500 gain—the strongest single-family appreciation on the Upper Cape and one of the best performances across all Cape Cod markets regardless of property type.
This surge happened even as sales volume declined 12.1% from 207 transactions in 2024 to 182 in 2025. Fewer homes came on the market, and when they did, buyers competed hard. The combination of strong demand and limited supply drove double-digit appreciation that outpaced most Cape towns.
What drove this performance? Mashpee single-family homes offer something increasingly valuable: Upper Cape location with South Cape Beach access, New Seabury resort amenities for those in that community, Mashpee Commons proximity, and price points that—even at $889,500—remain more accessible than premium Lower Cape markets like Chatham ($1.05M+) or Harwich Port. Buyers with $800K-$1M budgets discovered Mashpee delivered lifestyle and location without requiring $1.2M+ commitments.
The $889,500 median reflects a market where buyers prioritized space, privacy, and ownership over affordability. These weren't desperate purchases—they were strategic decisions by buyers who valued what single-family homes deliver and paid premiums to get it.
Looking ahead to 2026: as of early January (with only the first 12 days of data), current market conditions show 35 active single-family listings with 14 pending contracts—a ratio suggesting demand has moderated from 2025's surge but remains healthy. While it's too early to predict how the full year will unfold, if this 14/35 ratio holds through spring, single-family appreciation will likely moderate from 2025's exceptional +11.3% to more sustainable mid-single-digit gains as inventory normalizes.
CONDOS: THE CORRECTION STORY
Condo Performance: -3.9% Decline
Mashpee condos experienced the opposite story. Properties that sold for $557,000 in 2024 were trading at $535,000 in 2025—a $22,000 decline that represents a modest but clear price correction. However, sales volume actually increased 3.2% from 126 transactions to 130, showing buyers remained active despite falling prices.
The -3.9% decline reflects buyers negotiating more aggressively in a market with choices. Unlike single-family homes where limited inventory drove bidding, condo buyers found adequate supply and exercised pricing power. Sellers who priced realistically at or below $535,000 got deals done—those who held out for 2024 pricing sat longer.
What's important to understand: this isn't a condo market collapse. This is a rational correction from inflated 2024 pricing back to levels that align with buyer budgets and alternative options. At $535,000, Mashpee condos deliver Upper Cape access with low maintenance and strong rental potential—pricing that makes sense relative to value delivered.
The demographic driving condo purchases also differs from single-family buyers. Condo buyers typically include retirees seeking low-maintenance Cape living, investors focused on rental income, and first-time buyers stretching to access Cape Cod. These buyers are more price-sensitive than single-family buyers shopping above $800K, making condos more vulnerable to corrections when pricing exceeds perceived value.
Looking ahead to 2026: as of early January, 34 active condo listings face 13 pending contracts—similar to single-family's soft demand ratio. However, condo buyers looking for value after the -3.9% decline may find opportunities if sellers price realistically. The current 13/34 pending-to-active ratio suggests the market is still finding equilibrium, and buyers who recognize the value at $535,000 could benefit from continued seller motivation.
Complete Mashpee Property Type Performance Table 2024 vs 2025
WHY SINGLE-FAMILY AND CONDOS PERFORMED SO DIFFERENTLY
Looking at both property types together, the 15.3-point performance spread (+11.3% for single-family versus -3.9% for condos) reveals fundamental differences in what drove 2025's Mashpee market:
Inventory constraints favored single-family homes. Volume declined 12.1% for single-family homes (207 to 182 sales) while condo volume increased 3.2% (126 to 130). Limited single-family supply met strong demand, creating bidding pressure. Adequate condo supply gave buyers negotiating leverage.
Buyer priorities diverged by property type. Single-family buyers prioritized space, privacy, and long-term appreciation potential—they paid premiums for what they wanted. Condo buyers prioritized affordability, low maintenance, and rental income—they walked away from overpriced properties and waited for corrections. These different motivations created opposite price movements.
Price points attracted different buyer pools. At $889,500, single-family homes attracted buyers with substantial equity from sales in other markets or high household incomes—buyers less sensitive to rate impacts. At $535,000, condos attracted first-time buyers, retirees on fixed incomes, and investors calculating rental returns—buyers more sensitive to monthly payment changes and opportunity costs.
Mashpee's positioning matters. Upper Cape location makes Mashpee single-family homes attractive to buyers who want Cape access without Lower Cape premiums. But that same positioning makes Mashpee condos compete with alternatives across the Upper Cape where buyers can find similar low-maintenance options at similar or better prices.
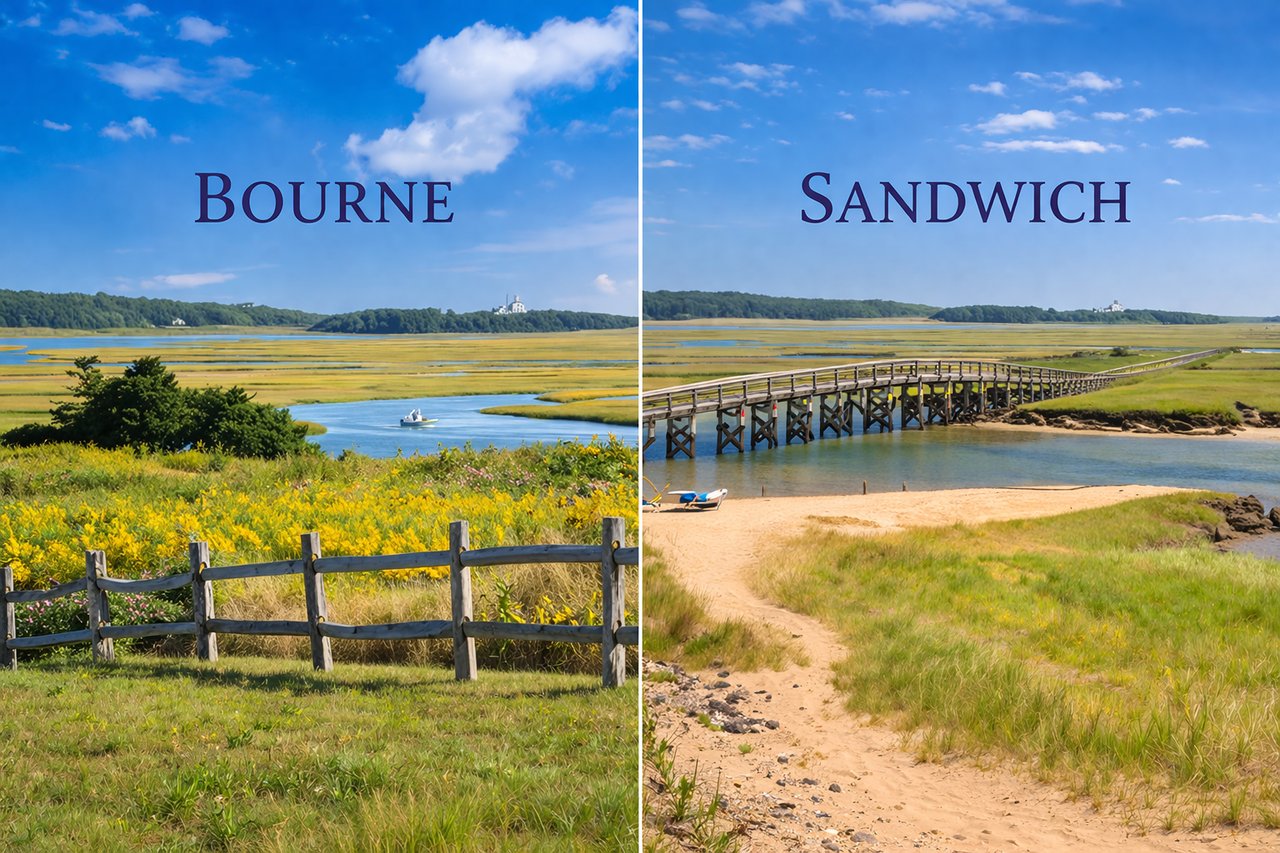
While Mashpee doesn't have village-level MLS data, comparing its property type performance to other Upper Cape markets reveals regional patterns:
|
Town |
SF Performance |
Condo Performance |
Combined |
Analysis Format |
|
Mashpee |
11.3% |
-3.9% |
7.5% |
Property type (no villages) |
|
Bourne |
Data pending |
Data pending |
TBD |
Village-level (7 villages) |
|
Falmouth |
Data pending |
Data pending |
TBD |
Village-level (8 villages) |
|
Sandwich |
Data pending |
Data pending |
TBD |
Village-level (3 villages) |
Source: Deborah Camuso market analysis, January 2026
What this shows: Mashpee's +11.3% single-family appreciation significantly outperformed most Cape markets in 2025, positioning it as one of the strongest Upper Cape performers for this property type. The -3.9% condo decline represents a correction, but combined with increasing sales volume (126→130), it signals a market finding its pricing level rather than experiencing distress.
For buyers, this means Mashpee single-family homes delivered exceptional returns in 2025 and may continue appreciating if inventory stays constrained. For condo buyers, the -3.9% correction creates a potential entry opportunity if you believe Upper Cape values will rebound. For sellers, understanding your property type's specific performance (+11.3% or -3.9%) matters far more than the misleading +7.5% combined number.
Planning to buy in Mashpee this year? Here's what 2025's property type performance means for your strategy:
If you're buying a single-family home: That +11.3% appreciation is real, but 35 active listings with only 14 pending means you'll have more negotiating room than 2025 buyers had. Don't assume 2025's surge continues at the same pace—single-family appreciation will likely moderate to +3% to +7% in 2026 as supply-demand balance normalizes. Look for properties priced at or slightly below the $889,500 median where sellers are realistic about current market conditions. New Seabury properties command premiums but verify amenity access justifies the price. Properties near Mashpee Commons or with South Cape Beach access offer lifestyle value that supports pricing.
If you're buying a condo: This is your value opportunity after the -3.9% decline. That 13 pending contracts on 34 active listings shows buyers are acting, but inventory exists for you to be selective. Look for condos priced in the $500K-$550K range where the correction has brought pricing in line with value. Condos with strong rental history, low association fees, and proximity to South Cape Beach or Mashpee Commons offer the best appreciation potential if the market rebounds. Avoid overpriced listings above $575K where sellers haven't adjusted to 2025's correction—those properties will sit while realistically priced condos move.
Budget-specific guidance:
Thinking about selling? Here's how to position yourself based on what happened in 2025 and current market conditions:
If you're selling a single-family home: You've got +11.3% appreciation and buyer demand in your favor. Price at or slightly below the $889,500 median to capture the 14 pending buyers currently in the market. At this price point, buyers expect quality—invest in professional staging, photography, and pre-listing inspections. Highlight New Seabury amenities if applicable, South Cape Beach proximity, or Mashpee Commons walkability. List in late February or early March before spring inventory increases. Properties priced 5-10% above recent comps will sit while realistically priced homes get multiple showings and competitive offers.
If you're selling a condo: Don't panic about the -3.9% decline—that 13 pending contracts shows demand exists at the right price. The critical move: price based on recent 2025 sales ($535,000 median), not 2024 peak pricing. Sellers testing the market 10-15% above current comps will watch buyers purchase from competitors who priced realistically. Highlight low association fees, rental income history, beach access, or resort amenities. Whether you're in New Seabury, near Mashpee Commons, or closer to South Cape Beach, emphasize what makes your condo specifically appealing. Condos priced competitively at $500K-$550K will attract multiple buyers; those priced above $575K need compelling reasons to justify the premium.
Pricing strategy by property type:
Current market data (as of January 12, 2026) reveals where Mashpee buyer activity is concentrating:
Single-family homes appreciated +11.3% and now have 35 active listings facing 14 pending contracts. This softer demand ratio (14/35 = 40% pending rate) suggests the 2025 surge has moderated. Buyers still want Mashpee single-family homes, but they're being more selective about pricing and condition. Properties priced realistically are moving; overpriced listings are sitting. The 14 pending transactions demonstrate continued interest, but the 35 active inventory shows buyers have choices they didn't have in 2025's constrained market.
Condos declined -3.9% but sales volume increased, and current conditions show 34 active listings with 13 pending contracts. Similar to single-family homes, the 13/34 ratio (38% pending rate) signals a market finding equilibrium after correction. Buyers recognize value at current pricing but won't chase properties priced above $550K-$575K. The active buyers (13 pending) are focused on condos offering strong rental potential, low fees, or resort amenities.
The takeaway: both property types show similar demand softness heading into 2026, but for different reasons. Single-family softness follows exceptional 2025 appreciation—buyers expect some moderation. Condo softness follows correction—buyers wait for sellers to fully accept new pricing reality. Spring inventory will determine whether these soft conditions persist or strengthen as more buyers enter the market.
Here's what the data suggests as Mashpee moves into the new year:
Mashpee's 2025 patterns show two distinct property type markets. Single-family homes delivered exceptional +11.3% appreciation driven by limited supply meeting strong demand from buyers prioritizing space and Upper Cape location. At $889,500, these homes offered compelling value compared to premium Lower Cape alternatives. That surge positions single-family sellers well but sets high expectations for 2026 buyers to manage.
Condos experienced a rational -3.9% correction from inflated 2024 pricing, bringing the $535,000 median back to levels that align with buyer budgets and competitive alternatives. Increasing sales volume (126→130) despite declining prices shows this correction didn't kill demand—it reset pricing to sustainable levels.
The overall picture shows 312 sales in 2025 versus 333 in 2024—6.3% volume decline suggesting modest market cooling but nothing dramatic. Single-family volume dropped more sharply (207→182) while condo volume actually increased (126→130), reinforcing that these are separate markets responding to different dynamics.
As we move into 2026, expect single-family appreciation to moderate from 2025's exceptional +11.3% toward more sustainable +3% to +7% gains as inventory normalizes. The 35 active, 14 pending ratio suggests this moderation is already starting. For condos, the market may stabilize around the $535,000 median or see modest rebounds (+2% to +5%) if buyers recognize the value opportunity post-correction. The 34 active, 13 pending ratio suggests equilibrium is close.
The data shows where values grew and declined in 2025 by property type. Now it's about positioning yourself—whether buying or selling—to capitalize on where each specific market is heading, not where it's been.
Q: Why did single-family homes surge +11.3% while condos declined -3.9%?
A: Single-family inventory declined 12.1% (207→182 sales) creating supply constraints that drove prices up as buyers competed. Condo inventory increased 3.2% (126→130 sales) giving buyers negotiating leverage that pushed prices down. Different inventory dynamics plus different buyer priorities (single-family buyers prioritizing space vs. condo buyers prioritizing affordability) created opposite price movements.
Q: Is Mashpee's +11.3% single-family appreciation sustainable in 2026?
A: Unlikely at that pace. The +11.3% surge reflected exceptional supply constraints meeting strong demand. As of early January 2026, 35 active listings facing 14 pending contracts suggests more balanced conditions. Expect single-family appreciation to moderate toward +3% to +7% in 2026 as supply normalizes—still healthy, just not exceptional like 2025.
Q: Should I avoid Mashpee condos after the -3.9% decline?
A: Not necessarily. The -3.9% decline represented a correction from inflated 2024 pricing, not market collapse. Sales volume actually increased (126→130), showing buyers remained active at corrected prices. At $535,000, Mashpee condos offer Upper Cape access with rental potential and low maintenance. Current demand (13 pending on 34 active) suggests buyers recognize the value—you just need to ensure sellers have priced realistically.
Q: Why doesn't Mashpee have village-level data like other Cape towns?
A: The MLS "Village" field shows only "Mashpee" for all properties in town, unlike Yarmouth (3 villages), Harwich (4 villages), or Barnstable (10 villages). This is a data structure limitation. For analysis purposes, property type comparison (single-family vs. condos) reveals more meaningful patterns than geographic segmentation would, especially given Mashpee's relatively compact geography.
Q: How current is this Mashpee analysis?
A: This analysis was completed January 12, 2026, using complete calendar year 2025 MLS data (312 total sales). Active and pending inventory reflects January 1-12, 2026 conditions—early year snapshot that will evolve as spring inventory arrives. The property type patterns observed in 2025—single-family surging +11.3%, condos declining -3.9%—may shift in 2026 depending on inventory levels and whether single-family demand sustains or condo buyers drive a rebound.
The numbers tell one story—but your specific situation tells another. Whether you're drawn to single-family homes for space and appreciation potential or condos for affordability and low maintenance, the right strategy depends on more than just appreciation rates.
If you're buying: The data shows single-family homes surged +11.3% while condos corrected -3.9%, but your ideal property type depends on what you need—space for a growing family, rental income potential, low-maintenance Cape retreat, or long-term appreciation. Let's talk about what matters to you. I'll show you what's actually available right now in both property types, explain which market conditions favor buyers versus sellers, help you understand where you'll get the most value for your budget, and position you to make your strongest offer when the right property appears.
If you're selling: Your home's potential depends on which property type you own, what condition it's in, when you list, and how you price it relative to 2025's dramatically different performance levels—not outdated 2024 comparisons. I'll walk through your property, explain what buyers in your property type market are looking for right now based on actual pending activity, suggest updates that actually add value for your specific property type (what matters for single-family differs from condos), help you price it to sell at the number you need while positioning it competitively, and create a marketing strategy that highlights what makes your property special in a market with choices.
Let's turn these property type insights and market condition signals into a strategy that works for your specific situation—whether you're buying your first Mashpee home or selling a property you've owned for years.
Call me at 508-335-3875, email me at [email protected], or reach out through my website anytime. I'm here to help you make sense of Mashpee's property type markets and position yourself for success in 2026.
I own my own boutique brokerage on Cape Cod, and after 25+ years analyzing this market, I've learned something most agents miss: the village you choose matters more than the town. While other brokers sell you on town-wide statistics, I've built my reputation on diving deeper—analyzing performance block by block, neighborhood by neighborhood, village by village. That's how I discovered Mashpee's single-family homes surged +11.3% while condos declined -3.9%—two completely different markets operating in the same town that the +7.5% combined number completely masks.
I've personally walked through thousands of Cape properties from Falmouth to Provincetown, studied over 10,000 transactions, and watched villages rise and fall through multiple market cycles. I know which streets flood, which neighborhoods hold value in downturns, which villages attract premium buyers, and which "hot markets" are actually cooling. This isn't generic real estate advice—it's intelligence you can't find on Zillow.
When you work with me, you're getting someone who will tell you the truth about a property even if it means walking away from a commission. You're getting hyperlocal market analysis that most brokers can't deliver because they're too busy chasing volume. And you're getting 25 years of Cape Cod expertise focused on one goal: making sure you don't overpay as a buyer or leave money on the table as a seller.
Let's talk: [email protected] | 508-335-3875 | debcamuso.com
Analysis based on MLS closed sales data for Mashpee properties (single-family homes and condos), January 1 - December 31, comparing 2024 and 2025 performance. Median prices, sales volume, and market condition figures derived from actual transaction records. Market insights reflect patterns observed across 312 closed sales in 2025 compared to 333 in 2024, with separate analysis of 182 single-family home sales and 130 condo sales in 2025. Active and pending inventory data reflects market conditions as of January 1-12, 2026. Mashpee has no village-level MLS breakdown; property type comparison used instead.


Deborah would love an opportunity to talk with you and show you why it would be a benefit to work with her. In a world full of uncertainty, she will guide you in the correct direction and ensure that you make the most confident decisions. Connect with Deborah - She is here to offer insight and support whenever you are ready.
Work With Deborah