Cape Cod Q2 2026: Where Prices Actually Rose—And Which Towns Are Gaining Speed
Deborah Camuso analyzed 974 closed Q2 2026 sales against 907 Q2 2025 sales across all 15 Cape Cod towns: Harwich led the Cape at +8.3% while Truro fell 25.9%, and separating single-family from condo sales reveals Barnstable's flat 1.4% town-wide number is actually hiding single-family homes up just 1.6% against condos up 27.4%. A look at momentum since Q1 shows Chatham and Harwich genuinely accelerating into summer, while Wellfleet's spring surge from a year ago did not repeat.
QUICK DATA: Cape Cod Real Estate Q2 2026
Market Overview:
Town-Level Price Appreciation (Combined Market):
Town | Q2 2025 Median | Q2 2026 Median | Change |
|---|---|---|---|
Harwich | $750,000 | $812,500 | +8.3% |
Dennis | $602,500 | $639,000 | +6.1% |
Bourne | $605,000 | $642,000 | +6.1% |
Falmouth | $837,500 | $879,000 | +5.0% |
Chatham | $1,335,000 | $1,367,500 | +2.4% |
Yarmouth | $600,000 | $610,000 | +1.7% |
Barnstable | $705,000 | $715,000 | +1.4% |
Eastham | $827,500 | $830,000 | +0.3% |
Brewster | $812,500 | $790,000 | -2.8% |
Mashpee | $667,500 | $629,000 | -5.8% |
Sandwich | $804,950 | $744,000 | -7.6% |
Provincetown | $1,136,000 | $1,047,500 | -7.8% |
Orleans | $952,750 | $799,000 | -16.1% |
Wellfleet | $1,120,000 | $903,000 | -19.4% |
Truro | $846,500 | $627,500 | -25.9% |
Source: MLS analysis by Deborah Camuso, July 2026
Fifteen towns, fifteen different stories. Harwich led the Cape at +8.3%, followed by Dennis and Bourne, both up 6.1%. On the other end, Truro fell 25.9% and Wellfleet dropped 19.4%—the two steepest declines on the Cape this quarter. Nine of the fifteen towns posted gains; six declined.
But a single town-wide number is still a blend—of every village inside that town, and of every single-family home and condo sale. Averaged together, that blend can hide real splits. (A quick example: Barnstable's town-wide number of +1.4% looks flat, but Osterville specifically fell 14.7% this quarter. If you want that level of detail for your own street, the full village-by-village breakdown for all nine Cape towns with village-level data is in a companion piece linked at the end of this post.) Here on the town level, the clearest and most useful split is between single-family homes and condos.
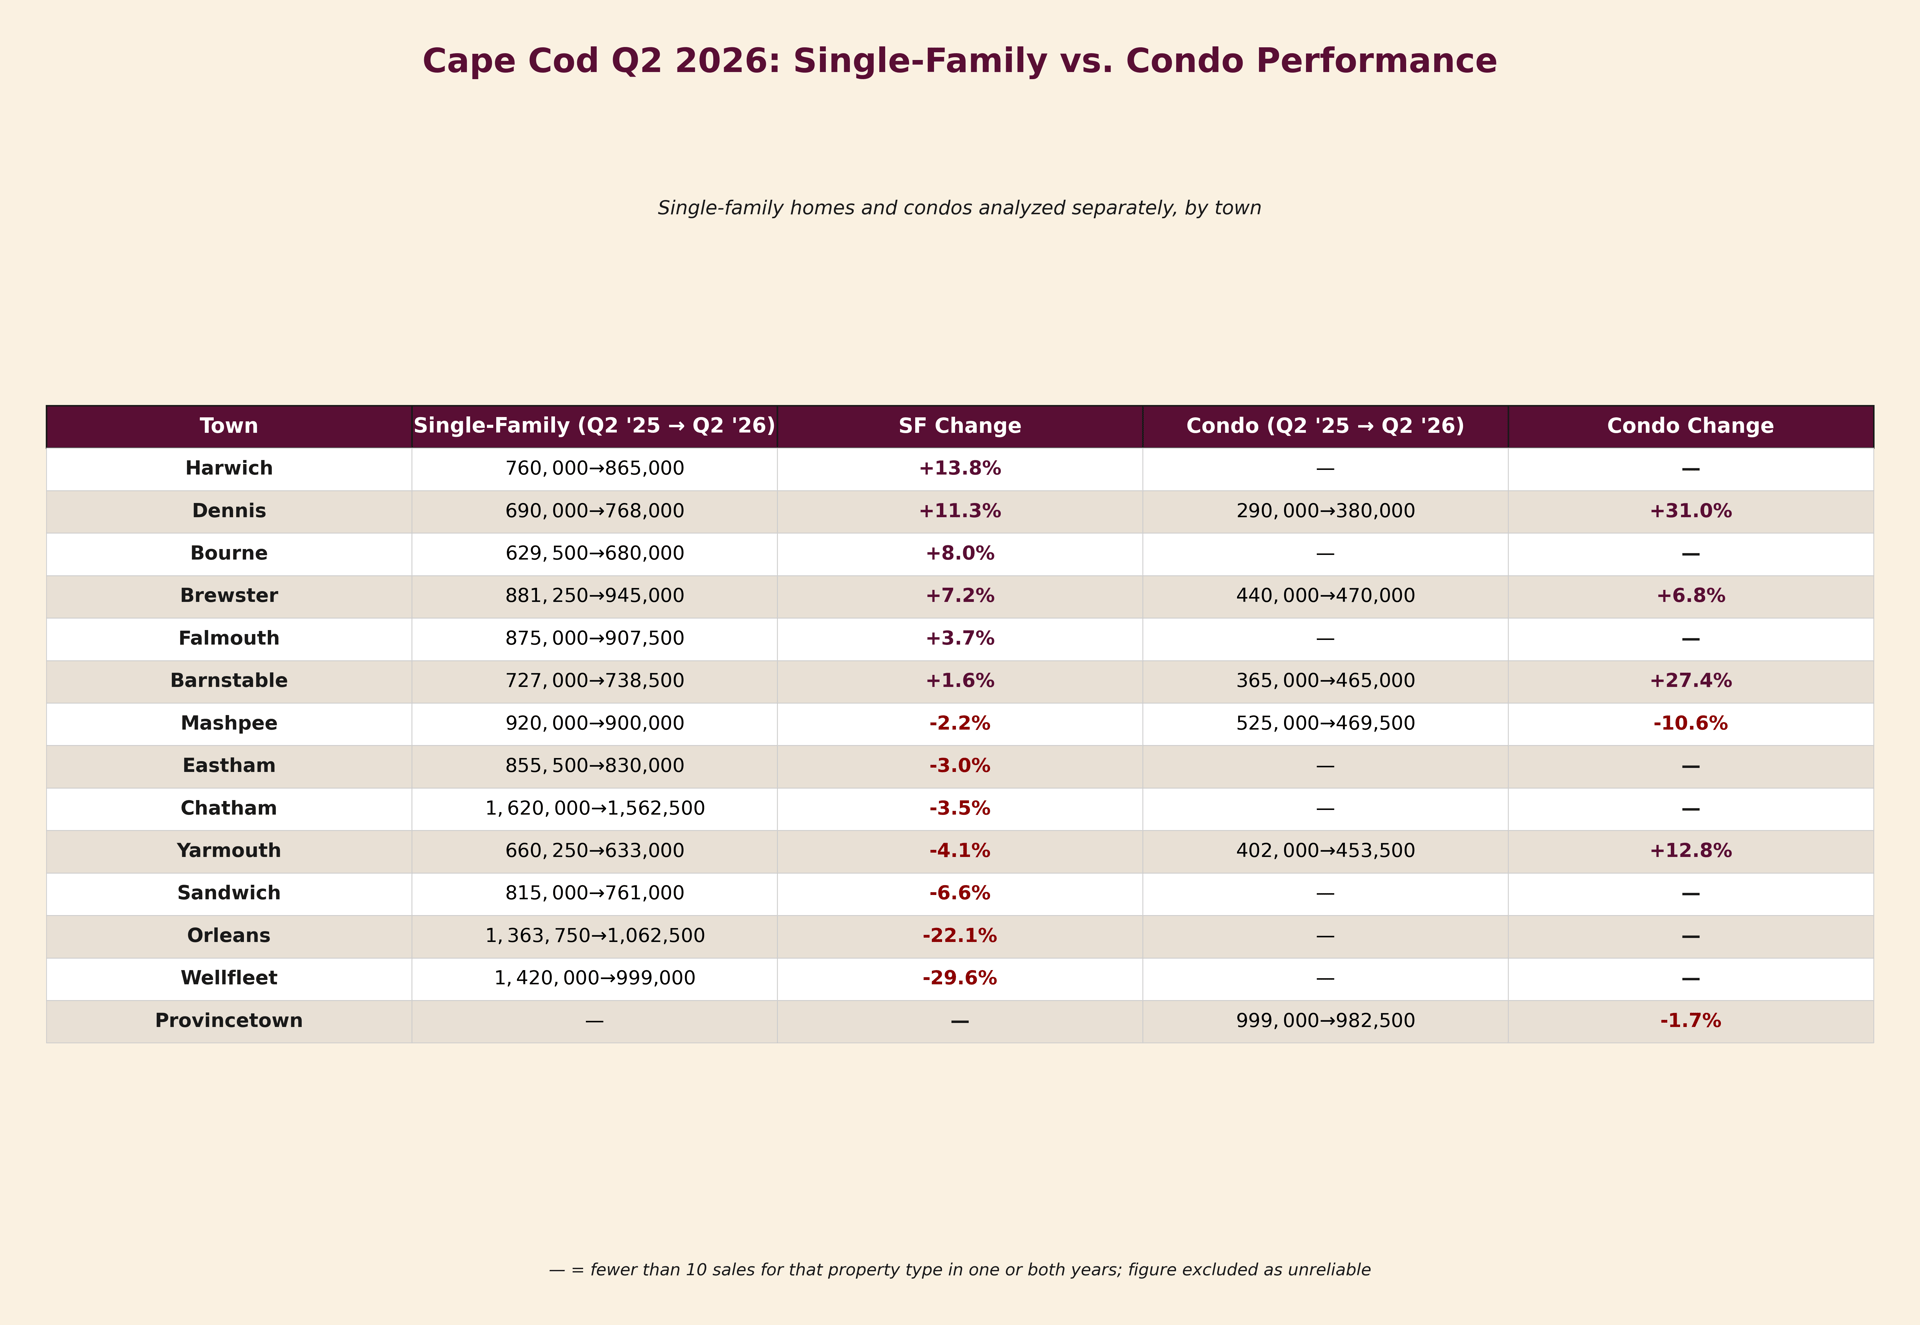
The same masking effect shows up again when you separate single-family homes from condos. Barnstable's flat 1.4% combined number is hiding two very different markets: single-family homes rose just 1.6%, from $727,000 to $738,500, essentially treading water, while condos jumped from $365,000 to $465,000, a 27.4% gain. In Yarmouth, the divergence runs the other way—single-family actually declined 4.1%, from $660,250 to $633,000, while condos rose 12.8%, from $402,000 to $453,500.
Neither town has a single market. Each has two—one for houses, one for condos—and this quarter the condo market is doing most of the work in both. Dennis and Chatham show the same pattern to a lesser degree.
Single-Family Homes (Town Level):
Town | Q2 2025 → Q2 2026 | Change |
|---|---|---|
Harwich | $760,000 → $865,000 | +13.8% |
Dennis | $690,000 → $768,000 | +11.3% |
Bourne | $629,500 → $680,000 | +8.0% |
Brewster | $881,250 → $945,000 | +7.2% |
Falmouth | $875,000 → $907,500 | +3.7% |
Barnstable | $727,000 → $738,500 | +1.6% |
Mashpee | $920,000 → $900,000 | -2.2% |
Eastham | $855,500 → $830,000 | -3.0% |
Chatham | $1,620,000 → $1,562,500 | -3.5% |
Yarmouth | $660,250 → $633,000 | -4.1% |
Sandwich | $815,000 → $761,000 | -6.6% |
Orleans | $1,363,750 → $1,062,500 | -22.1% |
Wellfleet | $1,420,000 → $999,000 | -29.6% |
(Truro and Provincetown single-family figures are based on fewer than 10 sales in one or both years and are directional only.)
Condos (reliable sample sizes only):
Town | Q2 2025 → Q2 2026 | Change |
|---|---|---|
Dennis | $290,000 → $380,000 | +31.0% |
Barnstable | $365,000 → $465,000 | +27.4% |
Yarmouth | $402,000 → $453,500 | +12.8% |
Brewster | $440,000 → $470,000 | +6.8% |
Provincetown | $999,000 → $982,500 | -1.7% |
Mashpee | $525,000 → $469,500 | -10.6% |
(Chatham, Wellfleet, Falmouth, Harwich, Sandwich, Bourne, Orleans, and Truro condo figures are excluded here due to sample sizes under 10 in one or both years—full village-level detail, including these towns, is available in the companion village breakdown linked below.)
Four towns—Dennis, Barnstable, Yarmouth, and to a lesser extent Brewster—show condos meaningfully outpacing single-family homes this quarter. Mashpee is the one town where both segments declined, though condos fell further than single-family. Harwich is the clearest single-family-driven winner, posting the Cape's strongest combined and single-family appreciation.
Part of this is simple math: condos in Barnstable, Dennis, and Yarmouth are appreciating off a meaningfully lower price base than single-family homes, so a $100,000 move reads as a much bigger percentage on a $365,000 condo than on a $1.2M house. Single-family pricing in Yarmouth and Mashpee also softened or stalled this quarter, which is consistent with either weaker demand at the higher price point or more conservative seller pricing—the data doesn't tell us which.
Cape Cod Q2 2026 Single-Family vs. Condo Performance Table
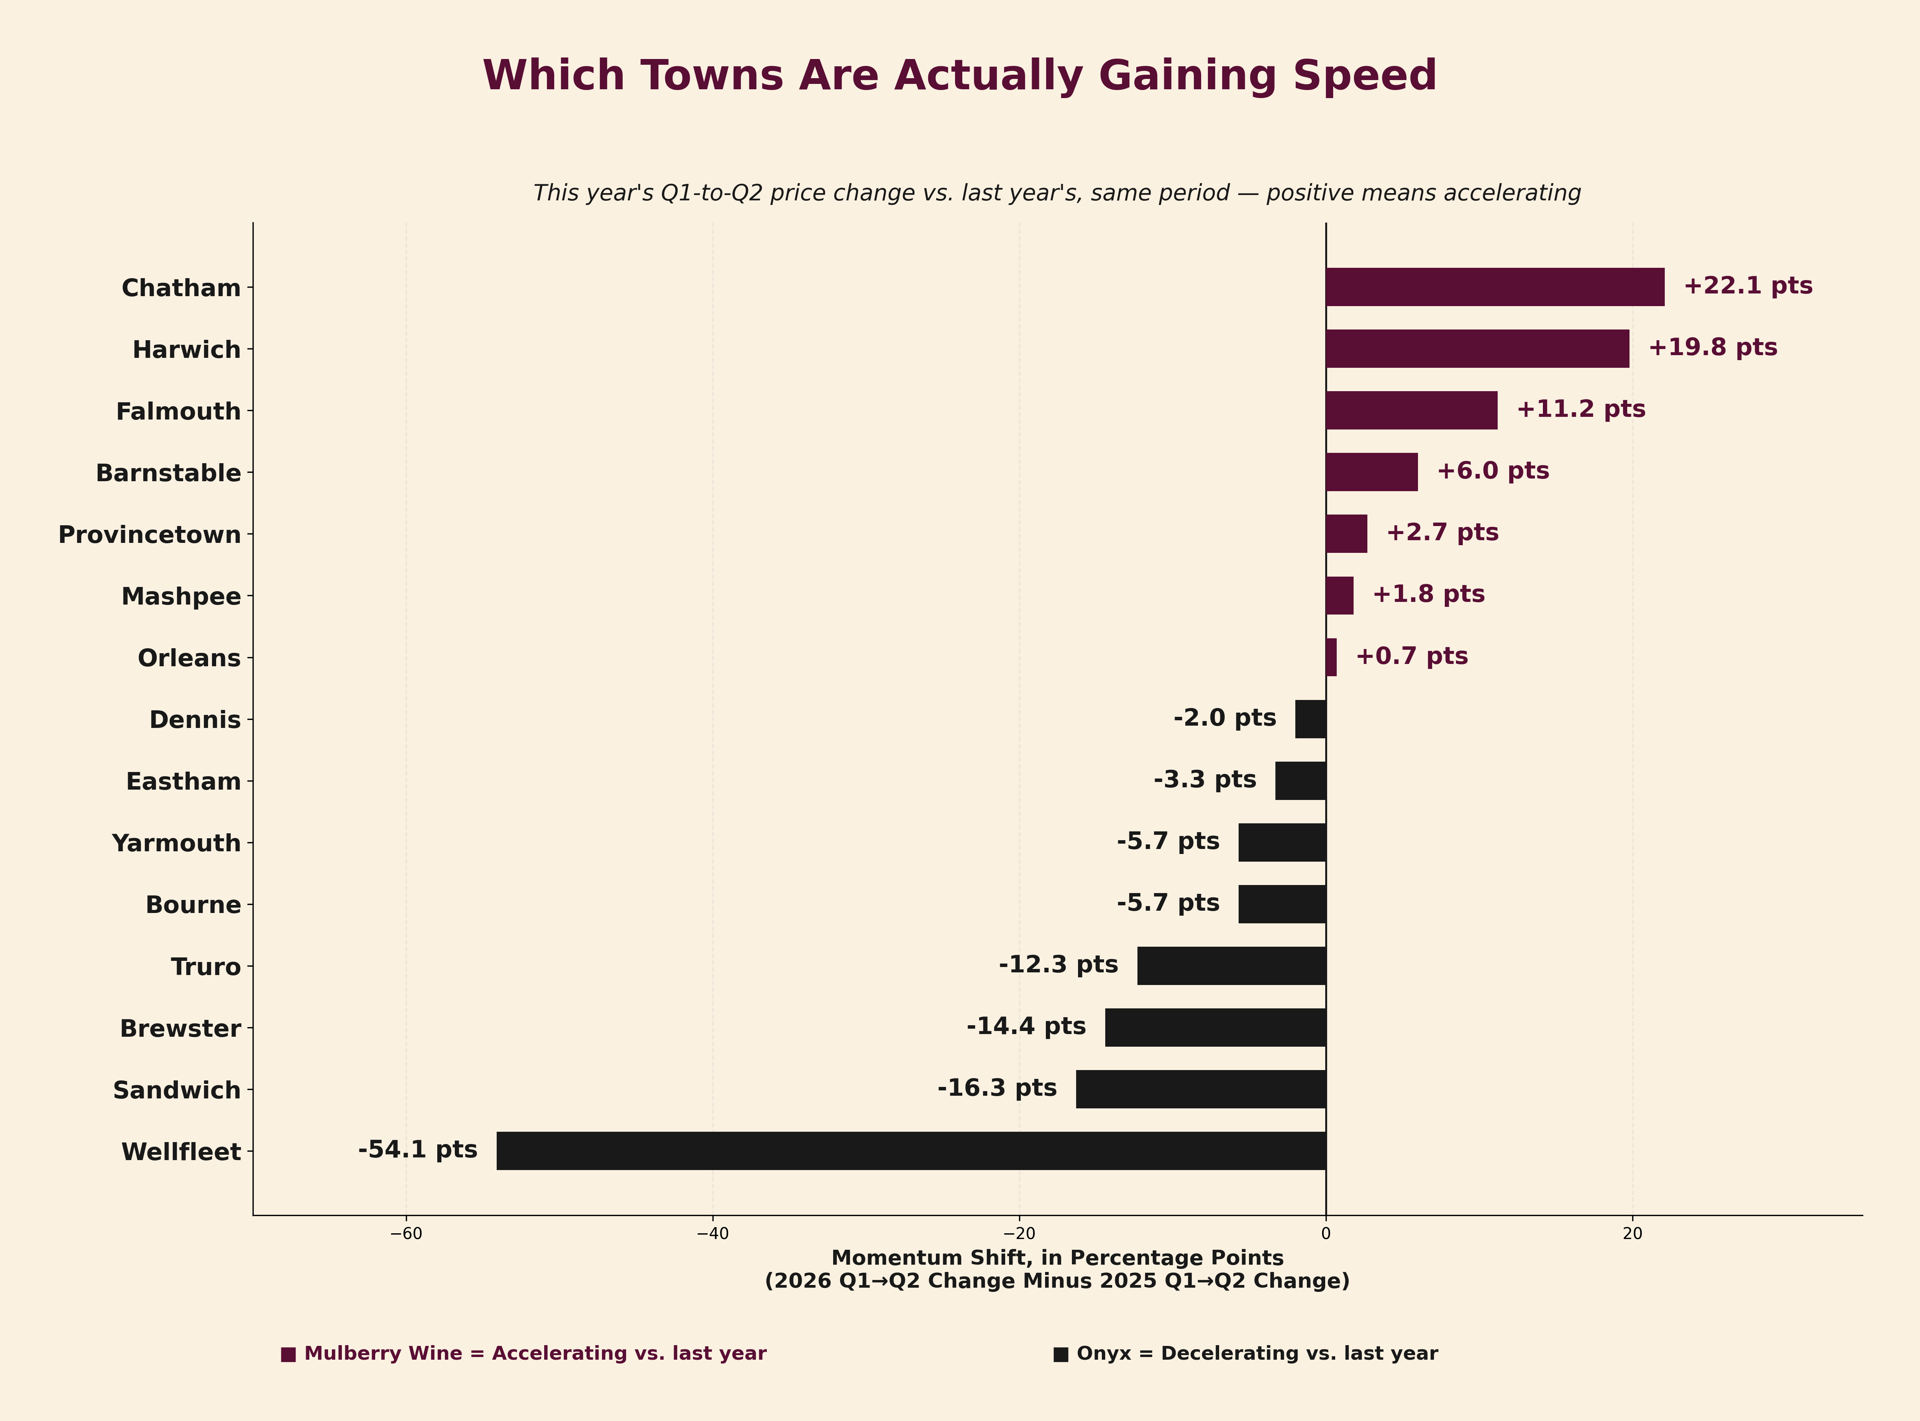
Comparing Q2 to Q2 tells you whether a town is more valuable than it was a year ago. It doesn't tell you whether that town's spring momentum is building or fading, because Q1-to-Q2 growth happens every single year just from the calendar—winter is always slower than spring. To separate real momentum from ordinary seasonality, Deborah Camuso compared each town's Q1-to-Q2 trajectory this year against its own Q1-to-Q2 trajectory last year.
Town | 2025 Q1→Q2 change | 2026 Q1→Q2 change | Momentum |
|---|---|---|---|
Chatham | -16.5% | +5.6% | Accelerating (+22.1 pts) |
Harwich | -6.2% | +13.6% | Accelerating (+19.8 pts) |
Falmouth | -1.5% | +9.7% | Accelerating (+11.2 pts) |
Barnstable | +0.7% | +6.7% | Accelerating (+6.0 pts) |
Provincetown | -5.3% | -2.6% | Improving, still soft |
Mashpee | -2.0% | -0.2% | Roughly steady |
Orleans | +0.6% | +1.3% | Roughly steady |
Dennis | +5.9% | +3.9% | Slightly decelerating |
Eastham | +8.5% | +5.2% | Slightly decelerating |
Yarmouth | +9.1% | +3.4% | Decelerating |
Bourne | +3.9% | -1.8% | Decelerating |
Truro | -21.3% | -33.6% | Decelerating |
Brewster | +40.8% | +26.4% | Decelerating |
Sandwich | +19.3% | +3.0% | Decelerating |
Wellfleet | +57.7% | +3.6% | Sharply decelerating |
Chatham and Harwich both had rough winter-to-spring transitions last year and are showing real acceleration this year—not just a seasonal bump, but a stronger spring than the same stretch produced in 2025. Wellfleet is the opposite story: last year's 57.7% Q1-to-Q2 surge did not repeat, and this year's much more modest 3.6% gain—while still technically positive—represents a significant loss of momentum worth watching into Q3.
Q1-to-Q2 Momentum Comparison, 2025 vs. 2026
If you're shopping for a condo in Barnstable, Dennis, or Yarmouth, understand you're competing in the segment of the market that moved the most this quarter. Sellers here have real comparable sales data justifying higher asking prices than a year ago—come prepared with financing in order and realistic expectations about negotiating room.
If you're shopping for a single-family home in Yarmouth or Mashpee, the data suggests less competitive pressure than the town's reputation might imply. Both towns saw single-family medians move flat to down, which may translate into more room to negotiate than in towns like Harwich or Dennis where single-family prices are climbing.
If your budget is concentrated in the $600,000-$800,000 range, several mid-Cape towns (Dennis, Bourne, Harwich) posted solid combined appreciation in that band, suggesting sustained demand at that price point going into the second half of the year.
If you want to know how a specific village inside any of these towns performed, the full village-by-village breakdown is linked at the end of this post.
If you own a condo in Barnstable, Dennis, or Yarmouth, this is a genuinely strong quarter to be listing—use the actual comparables, not the town-wide combined number, to support your asking price.
If you own a single-family home in Wellfleet, Orleans, or Truro, price conservatively and realistically. These towns posted the Cape's steepest single-family declines this quarter, and overpricing against last year's comps risks extended time on market.
If you're pricing a home in a specific village, get village-specific comparables before you set a list price—the full village breakdown is linked at the end of this post.
The village-level and condo-versus-single-family divergences uncovered this quarter are both worth watching through Q3. If they hold, they may reflect genuine, durable splits in how different parts of each town's market are behaving. If they narrow, this quarter's numbers may prove to be a temporary function of which specific properties happened to close in April through June.
Chatham and Harwich carry the clearest sustained-momentum story on the Cape this quarter—both are not just up year-over-year but genuinely accelerating compared to their own pace a year ago. Wellfleet deserves the opposite kind of attention: the loss of momentum is worth tracking into Q3 before assuming it's simply a one-quarter blip.
Q: Why did Truro and Wellfleet decline so much more than other towns?
A: Both towns have historically thin sales volume—Truro's Q2 2026 figure is based on just 9-13 sales depending on property type, and Wellfleet's on 8-15. A handful of transactions, especially at the high end, can swing a median substantially in a low-volume market. Treat both figures as directional rather than a precise read on long-term value.
Q: Why does Barnstable's combined number look flat when condos rose 27.4%?
A: Barnstable's combined median blends 142 single-family sales (up 1.6%) with 21 condo sales (up 27.4%). Because single-family sales far outnumber condo sales, the combined median is weighted heavily toward single-family performance, which masks the condo market's much stronger showing.
Q: Should I trust these percentages the same way for every town?
A: Only where the sample size supports it. Figures based on fewer than 10 sales in a given quarter are marked "small sample" or excluded from headline tables, because a single unusual sale can swing a small sample's percentage by 20 points or more.
Q: Is this data verified?
A: Yes. Every sales count in this analysis was independently cross-checked—single-family and condo counts were confirmed to sum to the reported total sales for both Q2 2025 (715 + 192 = 907) and Q2 2026 (727 + 247 = 974) before any percentage was calculated.
Q: How current is this data?
A: This analysis covers closed MLS sales from April 1 through June 30, 2026, compared to the same period in 2025, and was completed in early July 2026.
Q: Where can I see village-level data for my specific area?
A: The full village-by-village breakdown for all nine Cape towns with village-level MLS data—every village with a recorded sale, including Osterville, Harwich Port, Dennis Port, and every other village—is available in the companion analysis linked below.
Town-wide numbers make headlines. Village-level and property-type-level numbers make pricing decisions. If you're buying or selling on Cape Cod in the second half of 2026, the difference between those two numbers could mean tens of thousands of dollars.
I analyze every closed sale across all 15 Cape towns every quarter—not just the town-wide average, but the village breakdown and the single-family-versus-condo split that actually determines what your specific property is worth. For the complete village-level detail behind this analysis, see [Cape Cod Q2 2026: The Complete Village-by-Village Price Breakdown]. If you'd like to talk through what any of this means for your specific property, reach out directly.
Call me at 508-335-3875, email [email protected], or visit debcamuso.com.
ABOUT DEBORAH CAMUSO
I've been helping Cape Cod buyers and sellers navigate our unique village markets for over 25 years. I analyze every sale to understand what's really happening at the village level and property-type level—not just town-wide averages that can hide as much as they reveal. Whether you're buying your first Cape home or pricing a property you've owned for decades, I'm here to help you make the smartest decision based on real data.
Let's talk:[email protected] | 508-335-3875 | debcamuso.com
Analysis based on MLS closed sales data for all 15 Cape Cod towns (single-family homes and condominiums), April 1 - June 30, comparing 2025 and 2026 performance. Total sample: 974 Q2 2026 closed sales (727 single-family, 247 condo) versus 907 Q2 2025 closed sales (715 single-family, 192 condo); all counts independently cross-verified to sum correctly before any percentage calculation. Q1-to-Q2 momentum comparison uses Q1 2026 closed sales data (574 total, January 1 - March 31, 2026, re-pulled from MLS to capture late-reported closings) against Q1 2025 closed sales data (626 total, same period) to isolate year-over-year momentum from ordinary seasonal Q1-to-Q2 growth. Full village-level detail and methodology notes are available in the companion village breakdown. This analysis was completed July 2026 reflecting Q2 2026 market conditions as of that date.



Deborah would love an opportunity to talk with you and show you why it would be a benefit to work with her. In a world full of uncertainty, she will guide you in the correct direction and ensure that you make the most confident decisions. Connect with Deborah - She is here to offer insight and support whenever you are ready.
Work With Deborah