Cape Cod Q2 2026: The Complete Village-by-Village Price Breakdown
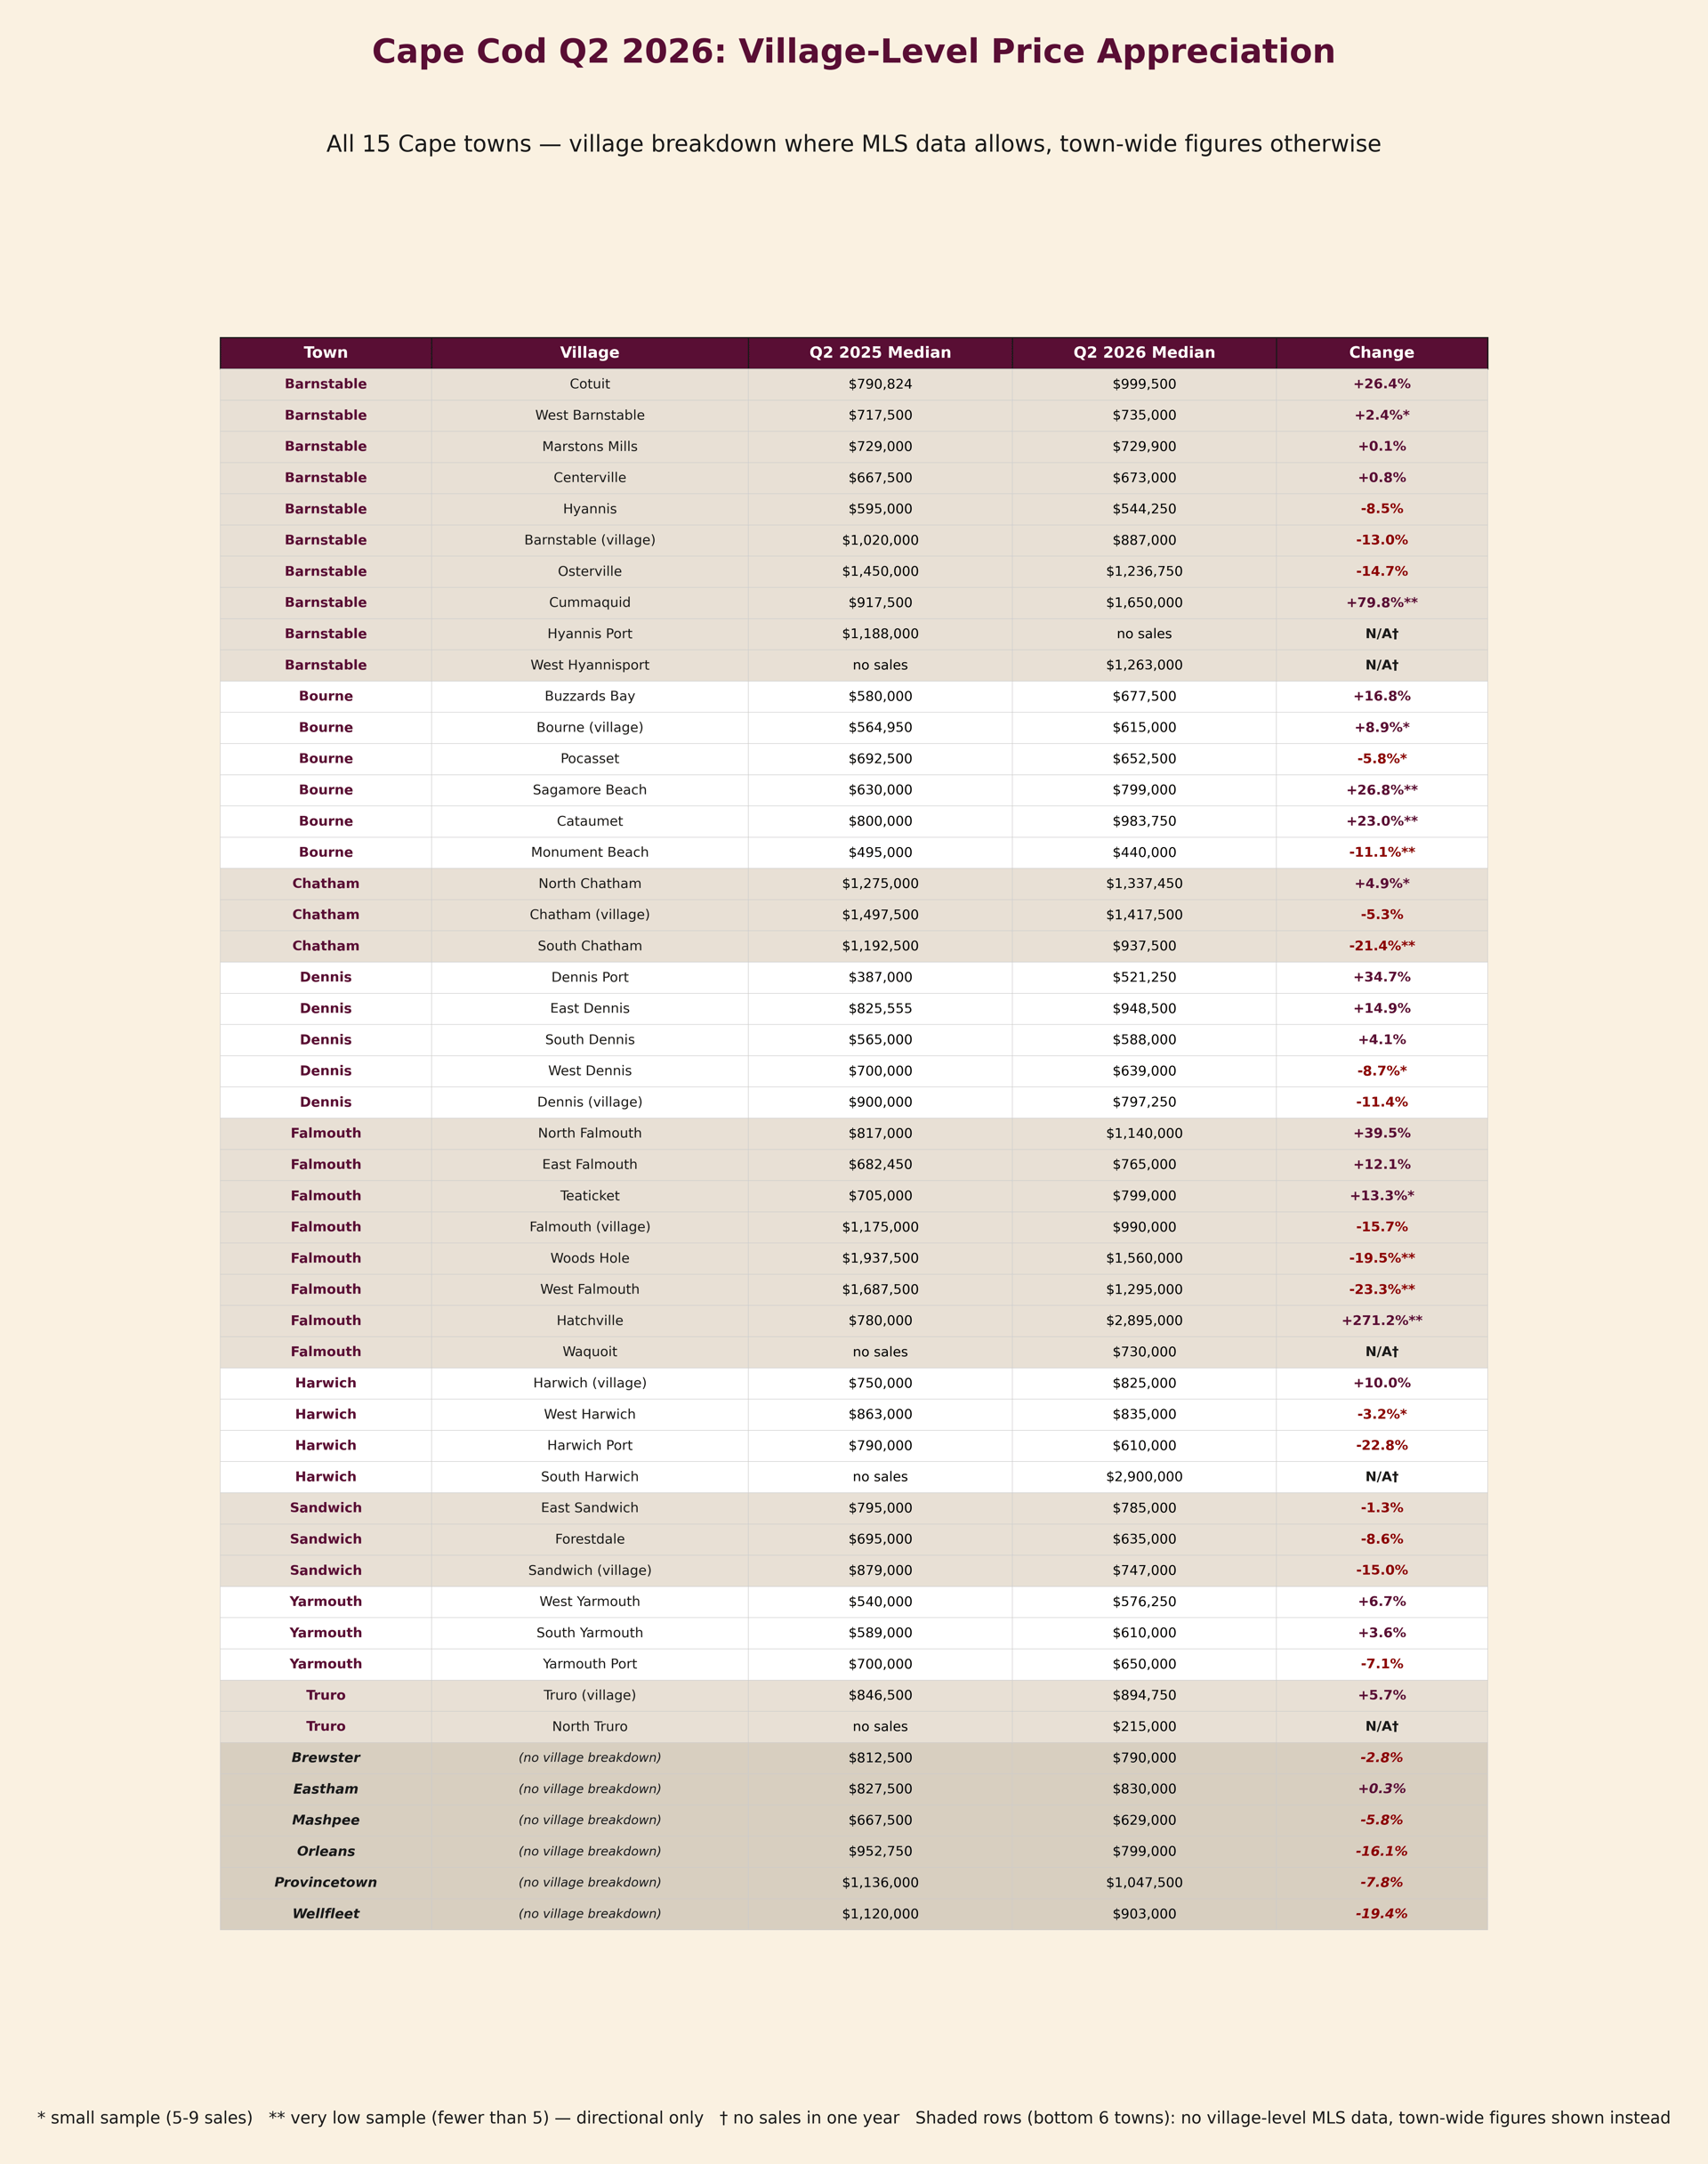
Deborah Camuso's Camuso Village-Level Analysis breaks down Q2 2026 price appreciation for every recorded village sale across all nine Cape towns with village-level MLS data—and found that Osterville, Harwich Port, and Falmouth village all moved in the opposite direction of their own town's headline number this quarter.
QUICK DATA: Cape Cod Village-Level Price Appreciation, Q2 2026
Market Overview:
Source: MLS analysis by Deborah Camuso, July 2026
If you own a home in Osterville, a Barnstable town-wide number that includes Hyannis, Centerville, and Cotuit doesn't tell you much about your own street. Barnstable's combined Q2 2026 median rose 1.4%—a headline driven almost entirely by a 27.4% surge in condo prices concentrated in a few villages. Osterville itself, meanwhile, saw its own median decline 14.7% this quarter.
That's not a contradiction in the data. It's exactly why [Cape Cod Real Estate Q2 2026: Where Prices Actually Rose] covers town-wide trends, and this companion piece exists to go one level deeper: every village, so you can see what actually happened where you live, not just what happened across an entire town.
Every village below reflects every recorded MLS sale for that location in Q2 2025 and Q2 2026. Villages with small sample sizes are labeled clearly rather than hidden—a single unusual sale can swing a small sample's percentage significantly, so treat those figures as directional, not precise.
Village | Q2 2025 → Q2 2026 | Sales (2025 → 2026) | Change |
|---|---|---|---|
Cotuit | $790,824 → $999,500 | 19 → 17 | +26.4% |
West Barnstable | $717,500 → $735,000 | 8 → 5 | +2.4% (small sample) |
Marstons Mills | $729,000 → $729,900 | 25 → 19 | +0.1% |
Centerville | $667,500 → $673,000 | 42 → 41 | +0.8% |
Hyannis | $595,000 → $544,250 | 37 → 44 | -8.5% |
Barnstable (village) | $1,020,000 → $887,000 | 15 → 10 | -13.0% |
Osterville | $1,450,000 → $1,236,750 | 17 → 24 | -14.7% |
Cummaquid | $917,500 → $1,650,000 | 2 → 1 | +79.8% (very low sample—not reliable) |
Hyannis Port | $1,188,000 → no sales | 1 → 0 | No Q2 2026 sales recorded |
West Hyannisport | no sales → $1,263,000 | 0 → 2 | No Q2 2025 sales recorded |
Osterville buyers and sellers should note: the village's own median actually declined 14.7% this quarter, in the opposite direction of Barnstable's town-wide condo-driven gain. If you're pricing an Osterville listing off a headline that says "Barnstable is up," that headline doesn't apply to you.
Village | Q2 2025 → Q2 2026 | Sales (2025 → 2026) | Change |
|---|---|---|---|
Buzzards Bay | $580,000 → $677,500 | 11 → 18 | +16.8% |
Bourne (village) | $564,950 → $615,000 | 6 → 11 | +8.9% (small sample) |
Pocasset | $692,500 → $652,500 | 8 → 6 | -5.8% (small sample) |
Sagamore Beach | $630,000 → $799,000 | 9 → 3 | +26.8% (very low sample—not reliable) |
Cataumet | $800,000 → $983,750 | 2 → 4 | +23.0% (very low sample—not reliable) |
Monument Beach | $495,000 → $440,000 | 1 → 1 | -11.1% (very low sample—not reliable) |
Sagamore (distinct from Sagamore Beach) had zero recorded MLS sales in Bourne during either Q2 2025 or Q2 2026—there is no data to report for that specific village this quarter.
Village | Q2 2025 → Q2 2026 | Sales (2025 → 2026) | Change |
|---|---|---|---|
North Chatham | $1,275,000 → $1,337,450 | 6 → 8 | +4.9% (small sample) |
Chatham (village) | $1,497,500 → $1,417,500 | 22 → 32 | -5.3% |
South Chatham | $1,192,500 → $937,500 | 2 → 6 | -21.4% (very low sample—not reliable) |
Village | Q2 2025 → Q2 2026 | Sales (2025 → 2026) | Change |
|---|---|---|---|
Dennis Port | $387,000 → $521,250 | 38 → 34 | +34.7% |
East Dennis | $825,555 → $948,500 | 11 → 20 | +14.9% |
South Dennis | $565,000 → $588,000 | 17 → 20 | +4.1% |
West Dennis | $700,000 → $639,000 | 21 → 9 | -8.7% (small sample) |
Dennis (village) | $900,000 → $797,250 | 15 → 18 | -11.4% |
Dennis Port's 34.7% jump is the single largest reliable village move on the Cape this quarter and is the primary driver of Dennis's strong town-wide condo number.
Village | Q2 2025 → Q2 2026 | Sales (2025 → 2026) | Change |
|---|---|---|---|
North Falmouth | $817,000 → $1,140,000 | 10 → 12 | +39.5% |
East Falmouth | $682,450 → $765,000 | 56 → 33 | +12.1% |
Teaticket | $705,000 → $799,000 | 5 → 25 | +13.3% (small sample in 2025) |
Falmouth (village) | $1,175,000 → $990,000 | 23 → 25 | -15.7% |
Woods Hole | $1,937,500 → $1,560,000 | 2 → 1 | -19.5% (very low sample—not reliable) |
West Falmouth | $1,687,500 → $1,295,000 | 2 → 3 | -23.3% (very low sample—not reliable) |
Hatchville | $780,000 → $2,895,000 | 12 → 1 | +271.2% (very low sample in 2026—not reliable; one luxury sale) |
Waquoit | no sales → $730,000 | 0 → 3 | No Q2 2025 sales recorded |
Falmouth village itself declined 15.7% even as North Falmouth and East Falmouth posted double-digit gains—multiple villages inside one town, moving in different directions. Hatchville's +271.2% is driven by a single $2,895,000 sale against 12 sales in the prior-year comparison period and should not be read as a real village trend.
Village | Q2 2025 → Q2 2026 | Sales (2025 → 2026) | Change |
|---|---|---|---|
Harwich (village) | $750,000 → $825,000 | 32 → 33 | +10.0% |
West Harwich | $863,000 → $835,000 | 7 → 7 | -3.2% (small sample) |
Harwich Port | $790,000 → $610,000 | 10 → 15 | -22.8% |
South Harwich | no sales → $2,900,000 | 0 → 1 | No Q2 2025 sales recorded; single 2026 sale, not a trend |
Harwich village itself is doing the heavy lifting for the town's strong overall number—Harwich Port, often the more prestigious of the two, actually declined sharply.
Village | Q2 2025 → Q2 2026 | Sales (2025 → 2026) | Change |
|---|---|---|---|
East Sandwich | $795,000 → $785,000 | 14 → 14 | -1.3% |
Forestdale | $695,000 → $635,000 | 13 → 13 | -8.6% |
Sandwich (village) | $879,000 → $747,000 | 39 → 42 | -15.0% |
Village | Q2 2025 → Q2 2026 | Sales (2025 → 2026) | Change |
|---|---|---|---|
West Yarmouth | $540,000 → $576,250 | 47 → 42 | +6.7% |
South Yarmouth | $589,000 → $610,000 | 37 → 39 | +3.6% |
Yarmouth Port | $700,000 → $650,000 | 29 → 36 | -7.1% |
Village | Q2 2025 → Q2 2026 | Sales (2025 → 2026) | Change |
|---|---|---|---|
Truro (village) | $846,500 → $894,750 | 10 → 10 | +5.7% |
North Truro | no sales → $215,000 | 0 → 3 | No Q2 2025 sales recorded; small 2026 sample, not a trend |
Brewster, Eastham, Mashpee, Orleans, Provincetown, and Wellfleet do not report village-level detail in the MLS Village field and are analyzed at the town level only—see the main Q2 2026 report for those towns' complete figures.
Village-Level Price Appreciation by Town
If you're looking in Osterville, Harwich Port, or Falmouth village, don't rely on the town-wide number—all three moved in the opposite direction of their town's headline this quarter. That may mean more negotiating room than the town's reputation suggests.
If you're looking in Dennis Port, North Falmouth, or Cotuit, understand you're competing in some of the strongest reliable village performance on the Cape this quarter—come prepared with comparables and realistic expectations.
If you're considering a village marked "small sample" or "very low sample" above—including West Barnstable, North Chatham, Teaticket, West Harwich, West Dennis, Pocasset, Bourne village, Cataumet, Monument Beach, Sagamore Beach, South Chatham, Woods Hole, West Falmouth, Hatchville, or South Harwich—treat the published percentage as directional only. A one-on-one comparative market analysis matters more than any published figure for these areas.
If you're pricing a home in Osterville, Harwich Port, or Falmouth village, do not anchor to your town's overall trend—each of these villages moved against it this quarter. Ask for village-specific comparables before you set a list price.
If you're in Dennis Port, North Falmouth, or Cotuit, the data supports confident pricing based on real, recent comparable sales in your specific village.
If you're in any village with a small recorded sample this quarter, a published percentage isn't a substitute for a direct comparative market analysis—reach out and I'll walk through the actual comparables for your street.
Q: Why do village numbers sometimes move in the opposite direction from the town number?
A: Town-wide medians combine every village and every property type into one number, weighted by how many sales happened in each. A town's headline number can be driven by strong performance in one or two villages (or one property type) while other villages inside the same town move differently or even decline. Osterville, Harwich Port, and Falmouth village all illustrate this in Q2 2026.
Q: Does this cover every village in these nine towns?
A: Yes—every village with at least one recorded MLS sale in Q2 2025 or Q2 2026 is listed above. The only villages not shown are ones with zero recorded sales in both years (for example, Sagamore in Bourne, distinct from Sagamore Beach), where there is simply no transaction data to report.
Q: Which villages have the least reliable data in this analysis?
A: Cummaquid, Hyannis Port, and West Hyannisport (Barnstable); Cataumet, Monument Beach, and Sagamore Beach (Bourne); South Chatham; Hatchville, Waquoit, West Falmouth, and Woods Hole (Falmouth); South Harwich; and North Truro all had fewer than 5 sales in one or both years and are marked "very low sample" above. West Barnstable, Bourne village, Pocasset, North Chatham, West Dennis, Teaticket, and West Harwich had between 5 and 10 sales and are marked "small sample." Treat all of these as directional, not precise.
Q: How current is this data?
A: This analysis covers closed MLS sales from April 1 through June 30, 2026, compared to the same period in 2025, and was completed in early July 2026.
Village-level data is where pricing decisions actually get made. If you want to know exactly where your street stands—not just your town—reach out and I'll walk you through the real comparables for your specific village.
Call me at 508-335-3875, email [email protected], or visit debcamuso.com.
ABOUT DEBORAH CAMUSO
I've been helping Cape Cod buyers and sellers navigate our unique village markets for over 25 years. With direct MLS access across all 15 Cape towns, I analyze every sale to understand what's really happening at the village level—not just town-wide averages that can hide as much as they reveal. Whether you're buying your first Cape home or pricing a property you've owned for decades, I'm here to help you make the smartest decision based on real data.
Let's talk: [email protected] | 508-335-3875 | debcamuso.com
Analysis based on MLS closed sales data for the nine Cape Cod towns with village-level MLS detail (Barnstable, Bourne, Chatham, Dennis, Falmouth, Harwich, Sandwich, Truro, Yarmouth), April 1 - June 30, comparing 2025 and 2026 performance. Every village with at least one recorded sale in either year is shown above; villages with zero recorded sales in both years (e.g., Sagamore in Bourne) are omitted because there is no transaction data to report, not due to any exclusion decision. Sample-size labels: "small sample" indicates 5-10 sales in at least one year; "very low sample" or "not reliable" indicates fewer than 5 sales in at least one year, meaning a single transaction can swing the reported percentage substantially. Brewster, Eastham, Mashpee, Orleans, Provincetown, and Wellfleet do not report village-level detail and are covered at the town level in the companion Q2 2026 market report. This analysis was completed July 2026 reflecting Q2 2026 market conditions as of that date.

Deborah would love an opportunity to talk with you and show you why it would be a benefit to work with her. In a world full of uncertainty, she will guide you in the correct direction and ensure that you make the most confident decisions. Connect with Deborah - She is here to offer insight and support whenever you are ready.
Work With Deborah